Fate of China’s CO2 Sealed with its Currency Regime
Written by:
Shakeb Afsah and
Kendyl Salcito • Mar 01, 2011
Topic: China
Everyone wants to blame the undervalued Yuan for global problems. Economists have claimed it will prolong the global recession. Pundits link the export-driven economy to lax environmental regulations and low labor standards. US Treasury Secretary Timothy Geithner called it a contributing factor in a round of capital controls and currency-market interventions by emerging economies.
For as much heat as the Yuan is getting, you’d think it was responsible for global warming.
Well, in fact, it partly is. An analysis of the latest data on CO2 emissions from the Energy Information Agency (EIA), released in Jan 2011, shows definitively what some policy analysts have long suspected: that China’s macro-economic policies have made its micro-economy a magnet for energy intensive and greenhouse-unfriendly industries (Hofman and Kuijs 2008; Bergsten et al. 2009).
 China’s CO2 emissions increased by 906 million tons in 2009 – the second largest annual increase for any country in recorded history. This emissions explosion is partly attributable to standard economic growth, but there is more going on. In national rankings, six of the ten largest single year increases in CO2 emissions are attributed to China (Exhibit-1). All these record-breaking CO2 spews occurred in the past decade—the period when China’s exchange rate was most closely regulated to boost exports. The export industries and their extensive supply chains are energy intensive and powered by coal, and their growth has surged during the last decade (Kahrl and Roland-Holst 2008).
Through the global recession, China’s depressed exchange rate protected its energy intensive industries, serving as a subsidy for export-oriented manufacturing industries (Wolf 2009). Other countries that would have grown their industrial sectors couldn’t compete against China’s deflated prices. So China has ended up with a lion’s share of industrial production within its economic pie, subjecting itself to a sub-optimally large share of CO2 emissions and other industrial pollution.
China's Contribution to Global CO2 Emissions
The Chinese themselves are the most immediate victims of this economic-environmental policy, as air pollution levels soar. But the impacts are global, pitting China against the rest of the world in the battle over CO2 reduction. Almost singlehandedly, China negated global emissions reductions last year. Data shows that global CO2 emissions from energy use stabilized during 2008 and 2009 (in fact, it declined by 97 million tons, or 0.3%), but the six top emitters (US, Russia, Japan, Germany, Canada and UK) and the rest of the world together reduced their CO2 emissions by 1.15 billion tons. China’s 906 million tons, combined with increases from India, Iran and South Korea, totaled a 1.06 billion ton increase in emissions. On net, the world made no gains (Exhibit-2).
Whence the Change?
The source of China’s current economic-environmental woes is easy to pinpoint. China joined the World Trade Organization (WTO) in 2001, signaling a new interest in export-oriented growth. That same year, emissions began a steady rise (Exhibit-3). Only four years later, the already devalued Yuan dipped even lower, dropping from just over 8 RMB per USD to under 7 by 2008. China’s currency control played a major role in boosting exports, but it also correlates with an increasing concentration of global CO2 emissions in China. This concentration can be calculated on what economists call the Herfindahl Index[1] (Exhibit-4), which shows spikes when monopolistic conditions arise and sinks when a larger number of countries (or firms, when calculated for an individual country) contributes to emissions. China is the emitter causing the spike beginning in 2001, just as the US (along with a few OECD countries) represented the high Index ratings in the 1980s.
 The distorting effects of exchange rate policies become clearer when China’s energy intensity is contrasted with other countries. As shown in Exhibit-5, China consumes on average close to two times as much BTU per person than India for a similar level of GDP per capita. In 2007 China consumed around 30 million BTU extra per person above the global average to produce the same per capita GDP. In fact, China’s per capita energy intensity is among the highest in the world, while its per capita GDP rates rise in line with other industrializing nations.
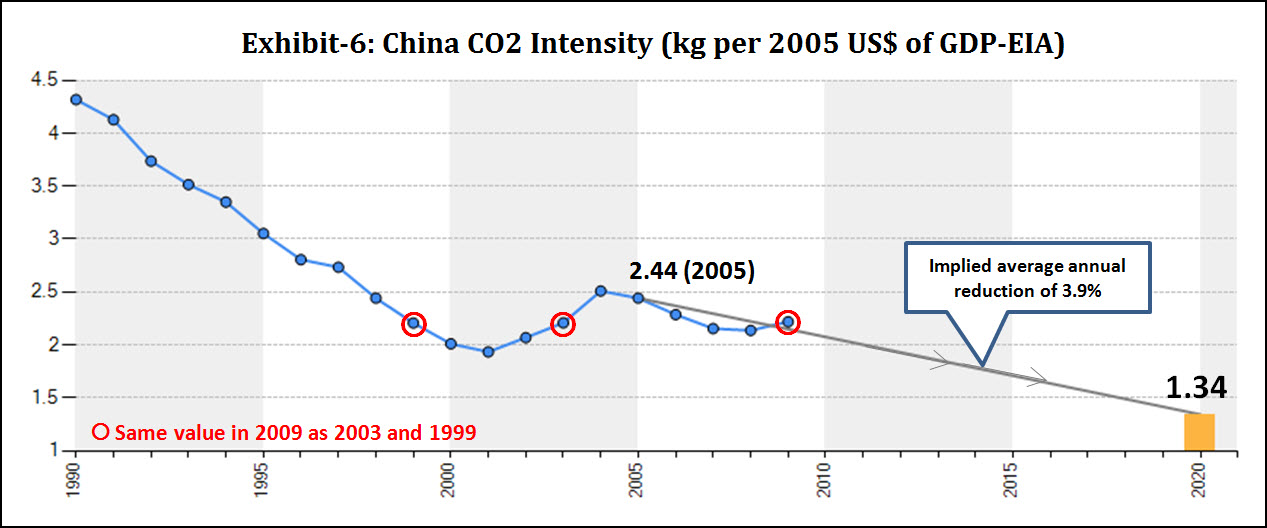
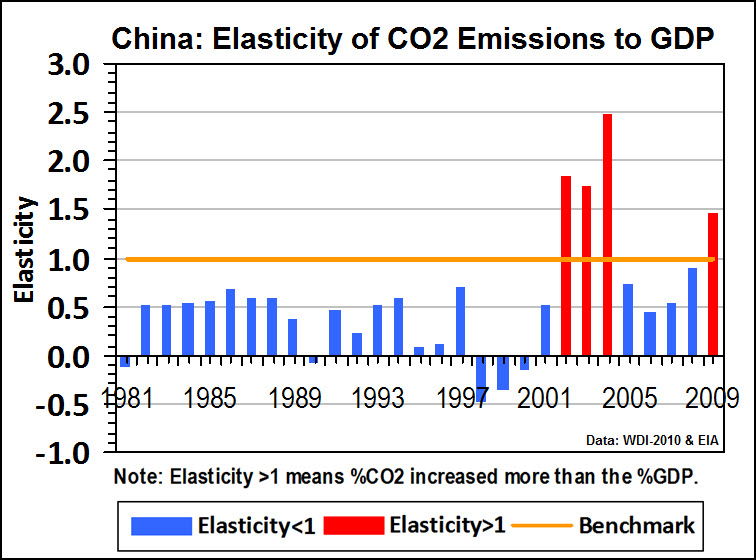
During the last decade, on four occasions China’s CO2 emissions grew faster than its GDP (see supplementary exhibit). The problem isn’t just that China’s pollution is outpacing its growth; it’s that the country is actually reversing the gains it made in energy and emissions efficiency in previous years. After four years of continual improvement between 2004 and 2008, China regressed to 1999 levels of CO2 intensity in 2009 (Soucre: EIA). This kind of reversal casts doubts about the reliability and robustness of improvements in energy and CO2 intensities, and indicates that environmental management alone may not be enough to generate lasting continual improvements in energy use at the economy-wide level.
China's Inadequate Actions
Given the challenge of reducing energy use and CO2 intensity, China’s efforts need to be more ambitious and policy oriented. China’s CO2 emissions trend in the past decade is unprecedented, adding 4.8 billion tons [per year] of CO2 to the atmosphere (source: EIA). In comparison, during the 14 years of a continuous spell of CO2 emissions increases in the US, between 1959 and 1973, Americans added around 2 billion tons (source: CDIAC).
To address its rapidly rising emissions, in Nov 2009, China announced its intention to reduce CO2 intensity from 2005 levels by 40-45% by 2020. This target, though impressive on paper, represents the status quo. Between 2005 and 2008 China’s average annual CO2 intensity reduction rate was 4.35%. At that rate, emissions would shrink by 45% in around 13 years – by 2018. Maintaining the 4.35% reduction rate would not require any additional effort on China’s part. But the 2020 goal only requires a 3.9% annual reduction. China is not just setting itself up for a business-as-usual carbon intensity reduction plan; it has committed to a lazier plan, allowing its emissions to continue increasing for an extended period of time (Exhibit-6).
Roger Pielke of University of Colorado, Boulder and Michael Levi from the Council of Foreign Affairs have been questioning the sufficiency of China’s efforts for years. Analysis of EIA data lends quantitative credence to their position. While China gains accolades for its targets and results (Seligsohn and Levin 2010; Houser 2010), data analysis clearly demonstrates that a 45% reduction in carbon intensity by 2020 will be insufficient to tackle the rate at which total CO2 emissions is currently increasing in China.
 If the discrepancy between China’s Government projections[2] and actual data are any indication, the country has long been aware that its development policy contributed to the problem, and its proposed solutions cannot solve it. Excessive CO2 emissions are driven by the increasing rate of output from energy
  intensive industries tied directly and indirectly to exports (it is important to bear in mind that while laptops, electronics, toys and plastics are not inherently polluting, the supply chains associated with each industry in China is hugely energy intensive, a point emphasized in Kahrl and Roland-Holst 2008). As shown in Exhibit-7, downstream industries like iron and steel, cement and synthetic ammonia had already exceeded the Government growth projections for 2020 by 2005 – 15 years ahead of schedule (Sheehan and Sun 2006).
Policy Implications
This note attempts to show that at the margin, China’s weak currency policy is creating sub-optimally high levels of CO2 emissions. The emerging broad lesson from this pattern of currency devaluation and emissions increases is that China cannot separate the macro from the micro – major changes must be made in both arenas. China is conducting energy audits (Shen, Price and Lu 2010), setting targets and shutting down old factories. Local governments are even forcing blackouts to meet energy intensity targets. But that doesn’t solve the larger issues caused by its current economic strategy. China’s coal consumption has soared to a total of 10.5 billion tonnes of oil equivalent since 2000 (source: BP)—more than the amount it consumed in the 20 years prior (from 1980-1999). That won’t stop until the monetary policy changes and Chinese companies compete with other industrializing nations on an even playing field.
References
Bergsten C.F, Freeman C., Lardy N.R. and Mitchell D.J (2009), “Energy Implications of China’s Growth”, Chapter 7, China's Rise: Challenges and Opportunities, Peterson Institute for International Economics, October 2009, Washington DC.
Hofman B. and Kuijs L. (2008), “Rebalancing China’s Growth”, Chapter 3, Debating China’s Exchange Rate Policy, edited by Goldstein and Lardy, Peterson Institute for International Economics, Washington DC.
Houser T. (2010), “Economic Drivers of Energy Use and Carbon Emissions in China”, ChinaFAQs, World Resources Institute, Washington DC.
Kahrl F., and Roland-Holst R. (2008), “Energy and exports in China”, China Economic Review 2008; 19(4):649–58.
Seligsohn D. and Levin K. (2010), “China’s Carbon Intensity Goal: A Guide for the Perplexed”, ChinaFAQs, World Resources Institute, Washington DC
Sheehan P., and Sun F. (2006), “Energy Use and CO2 Emissions in China: Retrospect and Prospect”, Center for Strategic Studies, Victoria University, Melbourne, Australia.
Shen B., Price L., and Lu H. (2010), “Energy Audit Practices in China: National and Local Experiences and Issues”, Lawrence Berkeley National Laboratory, Berkeley, California, December 2010.
Wolf M. (2009), “Why China’s exchange rate policy concerns us”, Financial Times, 8-December-2009
Data Sources
BP: British Petroleum Statistical Review of Energy
CDIAC: Carbon Dioxide Information Analysis Center-Oak Ridge National Laboratory (US)
EIA: Energy Information Agency (US)
IEA: International Energy Agency
WDI-2010: World Development Indicators 2010-World Bank
Download pdf
Supplementary Exhibit
[1] Herfindahl Index is used for analyzing the level of competition in a market using market share of each firm. It is calculated as the sum of the square of each company’s market share. We apply the same index using each countries CO2 emissions share for the top 50 emitters for the period 1980-2009. We are most interested in the trend, and as shown in Exhibit-3, the increasing trend from 2001 implies that the share of CO2 emissions from a large country like China has become a dominant contributor, and is large enough to shift the direction of the index.
[2] The primary source for the information cited in (Sheehan and Sun 2006): National Development Research Centre (NDRC) (2004), China National Energy Strategy and Policy to 2020: Subtitle 2: Scenario Analysis on Energy Demand, Beijing.