Red and Blue and CO2: Energy and Politics in the US
Written by:
Shakeb Afsah and
Kendyl Salcito • Mar 19, 2013
Topic: energy efficiency; politics
Summary
Polarization of climate politics at the national level has made state-level approaches to climate change increasingly relevant. But deep disparities in energy use and CO2 emissions at the state-level pose intrinsic obstacles to cohesive climate policy. We conducted an analysis to understand the various barriers to emissions reductions at the state level. After controlling for the effects of income, prices, industrial structure, climatic conditions and population density, we found that political orientation of states is correlated with high energy use and CO2 emissions. Data mining revealed that average energy use per capita is more than 55% higher for Republican leaning red states compared to the Democratic blue states. For CO2 per capita, red states are more than 80% higher compared to the blue states. Much of this difference in energy use and CO2 emissions can be traced to weak energy efficiency policies in red states.
We discuss policy implications and possible strategy for moving forward.
Corresponding author: Kendyl.Salcito@CO2Scorecard.org
We are thankful to Kevin Ummel and David Wheeler for their comments on this research note. All the views and opinions expressed in this note should be attributed only to the authors and the CO2 Scorecard Group. This research note is supported solely by the efforts and resources of The CO2Scorecard Group and the parent consulting firm Performeks LLC based in Bethesda MD, US.
Full Report
Even before President Obama's climate change heavy State of the Union address, policy analysts began considering what a national climate policy might look like. Two such recent reports by the Natural Resources Defense Council (NRDC) and the World Resources Institute (WRI) have placed energy efficiency as a fundamental building block of the national climate management policy in the US. A variety of strategies would be needed (prices, standards and informational incentives) to achieve a level of energy conservation that would make any measurable dent in the total CO2 emissions in the US. The likelihood of such a policy has been called into question, however.
A major barrier, identified by economists and climate policy wonks is the deep polarization in congress. The partisan politics of climate change don't stop at Capitol Hill, though. They are intimately connected to climate approaches at the state level, where republican politics correlate with soaring CO2 emissions and energy use.
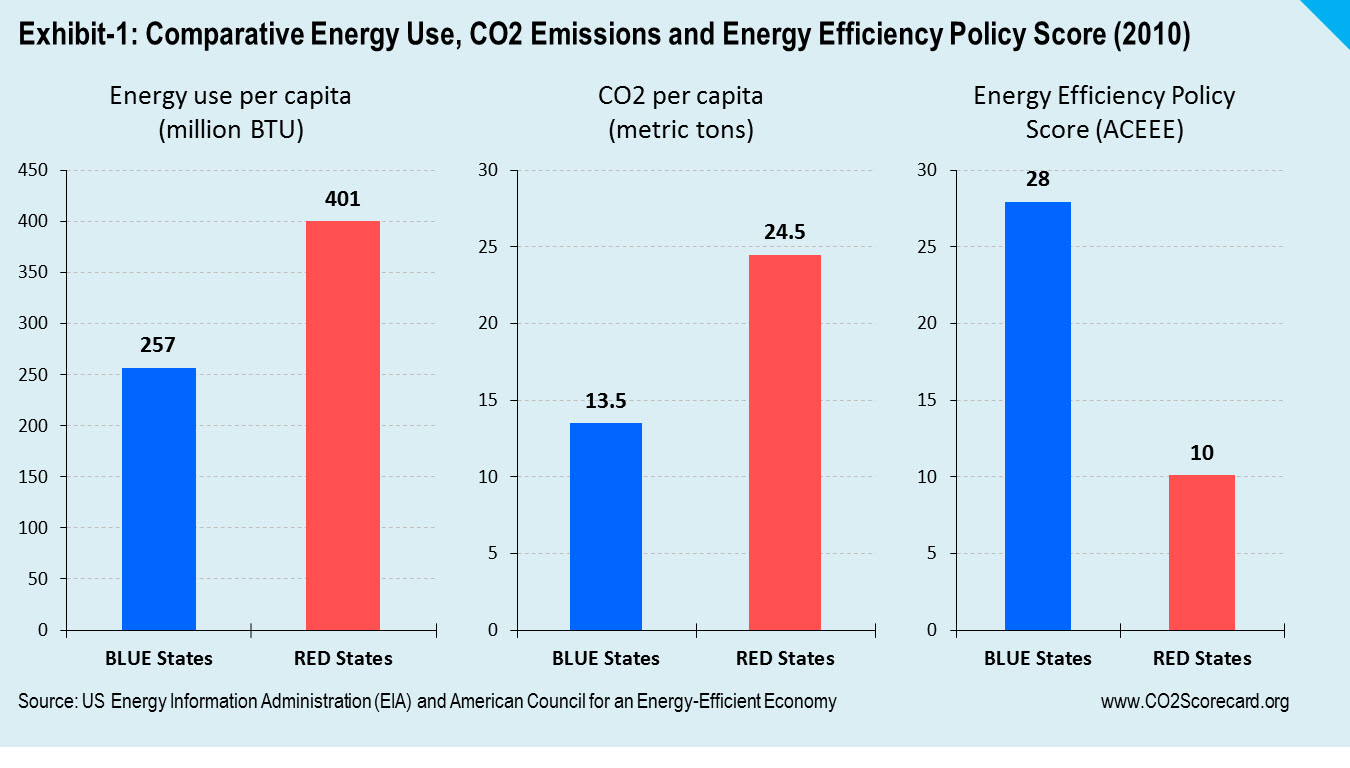
When we crunched the numbers, energy use in the red states came to 401 million BTU per capita compared to 257 million in the blue states; on average a resident in Republican leaning states consumes about 55% more energy than a resident in democratic leaning states (Exhibit-1).
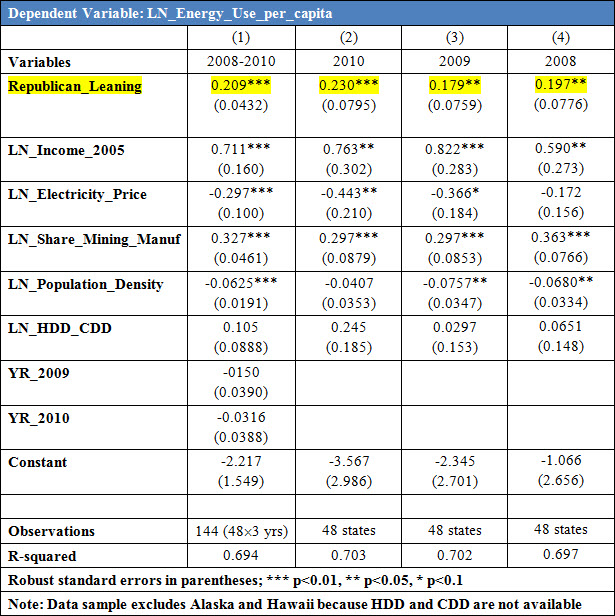
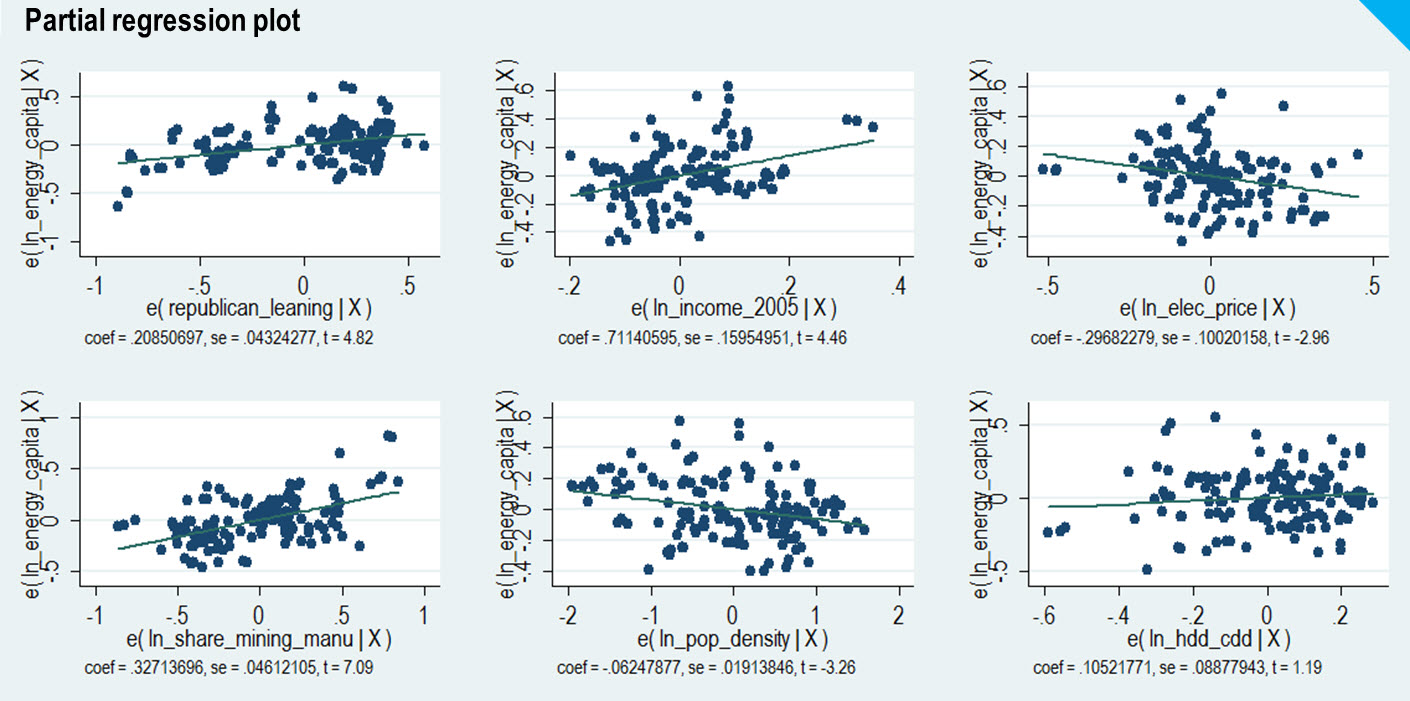
 To what can we attribute the difference in energy use? Prices, population density, industrial structure, income level and climatic factors are known to affect energy consumption. Accordingly we ran a regression model with five state-level control variables—income per capita, population density, price of electricity, share of manufacturing & mining sectors and number of heating and cooling degree days. Then we added a dummy variable for Republican leaning states (a value of one implied it was a red state, otherwise the variable had a value zero for a blue or a moderate state—see list in Appendix 3).
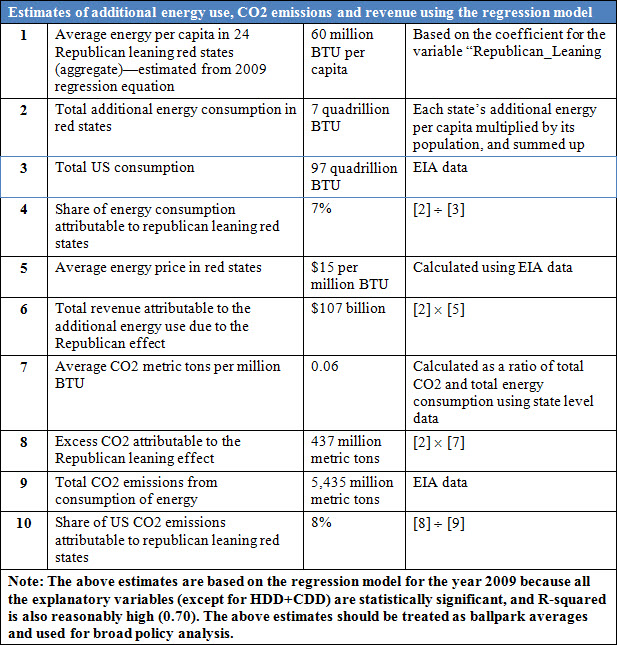
The regression result confirmed the relevance of known variables. In addition, though, it demonstrated an astounding correlation between republican politics and high per capita energy use, and this finding was consistent for each year between 2008-10 (Appendix-1). Further calculations using this regression equation showed that the difference in energy consumption due to the Republican influence came to an average of 60 million BTU per capita. In terms of additional energy attributable to Republican leaning red states, the total came to approximately 7 quadrillion BTU or around 7% of the total US consumption (Appendix-2).
When it comes to CO2 emissions per capita, the difference is even larger—red states generate on average 24.5 metric tons of CO2 per capita compared to 13.5 metric tons in blue states—a difference of 80%. Since the percentage difference is higher for CO2 compared to energy use, it implies that red states not only consume more energy on per capita basis but the energy they consume is dirtier and more CO2 intensive—indicating a higher proportion of fossil fuel in their energy mix. Gratuitous, excess emissions from red states amount to a ballpark average of 430 million tons of CO2 emissions—this represents around 8% of the total energy related CO2 emissions in the US (Appendix 2).
Policy Factor
One explanation is politically-driven climate policy. The ACEEE generates an energy efficiency scorecard every year. It is designed to measure the quality of energy efficiency policies at the state level in the US using a score from 0-50. Scores are generated using a comprehensive evaluation framework covering public utility programs, transportation policies, energy-efficient building codes, combined heat and power, appliance efficiency standards and state government initiatives (financial incentives, government greening, and eco R&D).
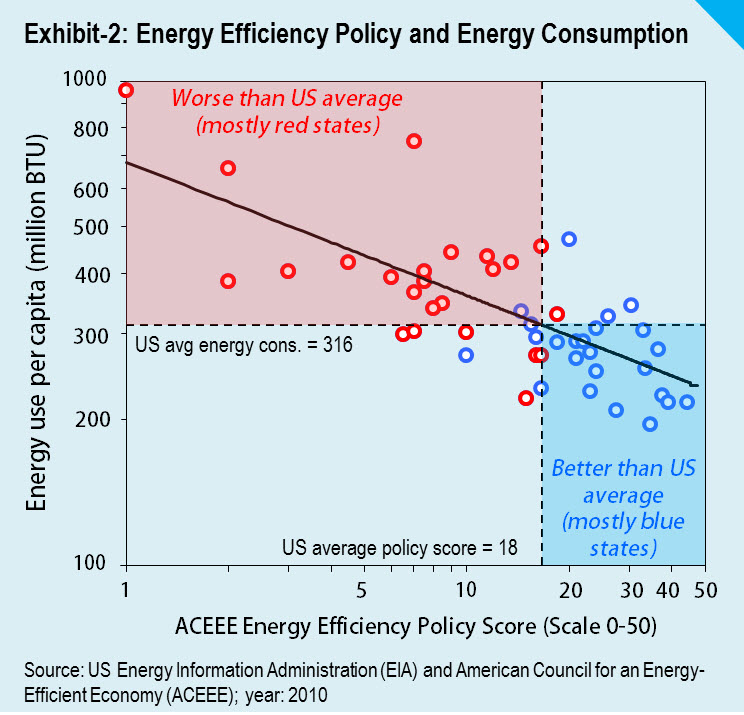 ACEEE energy efficiency policy scores are strongly correlated to energy use—a high score is associated with low energy use per capita and vice versa (Exhibit 2). Correspondingly, most red states are worse than the US average for both energy use and energy efficiency policy (the red shaded area). Therefore, it is no surprise that the average energy efficiency policy score for red states is just 10 points out of fifty compared to a score of 28 for blue states.
Probable Cause: Economics and Finance
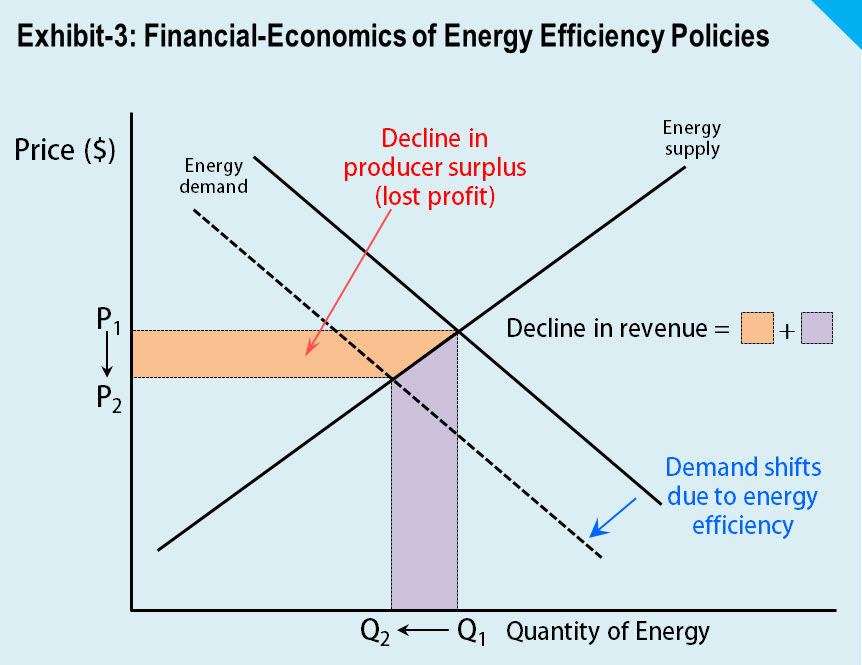
And why exactly are energy efficiency policies weak in Republican leaningstates? As shown in Exhibit-3, energy efficiency programs cut the demand for energy, which cuts energy suppliers revenue as well as its economic profits(producer surplus). When energy efficiency improves, much of what producers lose in surplus translates into economic benefits for energy end-users (consumer surplus). Similarly, revenue losses from lower energy supply become hard-cash savings for energy users. Therefore, in states thathave strong energy efficiency policies, consumers win—but at the cost of energy producers. In Platts blog post, Macquarie Equities Research recently described the phenomenon as it is playing out in the electricity sector:
Energy efficiency measures really do seem to be having an impact on electricity demand, and the effect is likely to continue. It’s not just theoretical or wishful, the analysts said. “Unfortunately for investors,” the firm said, “utilities expect this demand destruction to continue or even accelerate.”
 Data echo this sentiment—according to the EIA, net generation from electric utilities fell by 4.7% in 2011-12. Modern energy efficient appliances, new building standards and other measures are leading to energy savings that, on net, is high enough to supersede the compensating effect of other factors like income, population growth and rebound. Even in the lighting sector, total electricity use declined by 8% during 2001-2010, driven entirely by improvements in the efficacy of lighting sources (lumens per watt). As reported in The Wall Street Journal, these declines reflect market forces and policies that are increasing the stock of energy efficient durables in American households.
Energy efficiency can be a revenue loser for energy suppliers, and, in the short-term, for the state economies dependent on them. As our calculations show, an average consumer in the red states uses around 60 million BTU more than the average consumer in the blue and moderate states. With a population of more than 115 million persons in red states, total additional energy consumed solely due to the fact that it is a Republican leaning state adds up to around 7 quadrillion BTU. In revenue terms, that amounts to more than $100 billion for energy suppliers (Appendix-2). This corporate revenue may be what sustains industry and retains jobs, but it is also a financial hit for consumers.
As energy conservation takes root in our society, one should expect the resistance to energy efficiency policies to only intensify in the Republican leaning states where energy producers have political edge over environmental groups. A recent example from Louisiana, where state-wide energy efficiency program was halted, lends credence to this theory. Louisiana, which is ranked 43rd nationally on ACEEE energy efficiency policy scorecard, received a score of only 9 points in 2012. It badly needs energy efficiency initiatives but politics may be getting in the way. Louisiana's mineral revenue in 2011 totaled over $1.4 billion – that covered over 5% of the state's budget that year.
Policy Implications
The striking difference in the adoption of energy efficiency policies in Democratic and Republic leaning states in the US highlights the grim reality of political opposition to any comprehensive national-level climate action plan. Given the deep roots of Republican opposition to energy efficient policy shifts, a policy mix that includes carbon-tax and cap-and-trade faces even bleaker prospects. This reality has two major policy implications.
First, state level efforts to reduce CO2 emissions could be strengthened, but it is likely to be fragmented along partisan lines. Therefore ideas for cutting CO2 emissions put forth by groups like the NRDC and the WRI will be embraced only partially—perhaps covering a little more than half the US.
Second, centrist ideas like so-called climate pragmatism won’t work because they severely under-estimate the true extent of political resistance to climate policies. Pragmatism seeks Republican support for only a very narrow sliver of climate-friendly policy, at the expense of many core strategies including energy efficiency, carbon tax, cap and trade, emissions standards and disclosure. It's strategy to seek a common denominator between political parties sets the bar extremely low. Climate change cannot be reversed by anything but an effective mix of policies and practices, and the proposed pragmatism not only closes the doors to too many but it drags us into policy no man’s land that solves very little. The rejection of energy efficiency by red states shows that climate pragmatism is a political fantasy. Real pragmatism results from sincere mutual efforts to solve a recognized problem.
Possible Way Forward
As the urgency for climate actions has increased, expectations of any comprehensive nation-wide climate policy in the short and medium term have only decreased. A very significant political transformation is therefore needed to turn the tide in favor of comprehensive policies based on pricing carbon. Such a transformation needs to be of the same scale that compelled the Republican Party to support gay marriage and consider immigration reform.
One promising pathway to such a political transformation is through sustained information campaign and environmental activism. A 2011 paper titled “Complex constituencies: intense environmentalists and representation” by Prof. Sarah Anderson of the University of California at Santa Barbara shows that environmental activism at the district level has the ability to influence the voting behavior of the members of the US Congress from both parties.
In this context, Bill McKibben’s proactive and impassioned environmentalism has the capability to connect with the younger generation that has just reached or is yet to reach the voting age. Irrespective of the outcome on the Keystone XL pipeline, McKibben's 350.org campaign has far reaching consequences because it is a galvanizer and a political force. In a matter of few years there will be a whole new base of voters. Just like the mass of new voters that tilted the political forces in favor of gay marriage, a new base of well-informed voters could transform the politics in favor of comprehensive climate action. Therefore, intensification and broadening of environmental activism is perhaps a desirable strategy for turning the corner on climate policies.
Final Thoughts
In this research note we show that Republican leaning states consume significantly more energy and release even higher CO2 compared to their counterpart in Democratic and moderate states. We explain how weaknesses in state-level policies contribute to this outcome and connect the dots between technical policies like energy efficiency and partisan politics. From this we extrapolate to highlight the depth of political resistance that any comprehensive nation-wide climate action plan faces in the US. We emphasize that a fundamental shift in the political landscape is needed—as we witnessed in the cases of gay marriage and immigration reform. Similar reform will require patient environmental activism and information campaign to ultimately bring the Republican Party to the negotiating table—then meaningful pragmatism will automatically kick in.
References
All references are hyperlinked.
Note: For a parallel theme, readers may also be interested in a recently published paper in Economics Letters titled, “Do liberal home owners consume less electricity? A test of the voluntary restraint Hypothesis” by UCLA economists Dora Costa and Matthew Kahn. This paper was covered by Grist and the magazine Pacific Standard. [download]
Appendix 1: Regression results
NOTE: To properly evaluate causality, a more sophisticated regression is needed to adequately account for endogeneity caused by omitted/unobserved variables and simultaneity. That approach will need 2SLS using instrumental variables. While this methodology is well sorted out in theory, this approach is also not free from practical problems. We hope researchers will build on what our analysis suggests about the underlying politics regarding energy management and climate change.
Appendix 2: Estimates based on regression equation
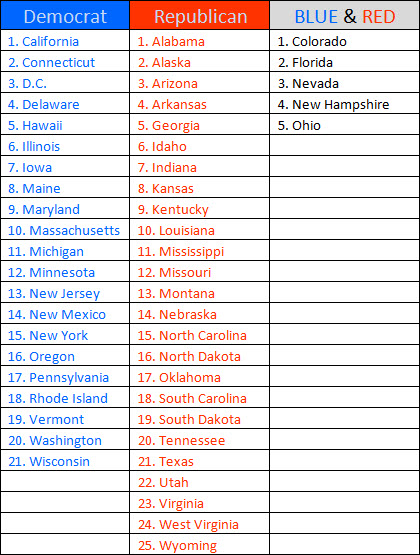
Appendix 3: Red and blue states
This classification reflects the data period going up to 2010. It is possible to have a difference of opinion regarding the grouping of states but the statistical results are quite robust and such adjustments at the margin are unlikely to change the overall statistical findings and the differences in averages for red and blue states. [Observation: The averages for the five blend/moderate states are: (1) energy use-270 million BTU/capita, (2) CO2 emissions-16 metric tons/capita and (3) energy efficiency policy scorecard-20)