Demand Reduction Slashes US CO2 Emissions in 2012
Written by:
Shakeb Afsah and
Kendyl Salcito • May 01, 2013
Topic: CO2 emissions
Summary
Energy related CO2 emissions in the US fell by 205 million metric tons in 2012. CO2 Scorecard breaks it down and shows that nearly 75% of the decline is accounted for by demand reduction primarily due to the economy-wide energy efficiency and conservation measures in the transportation, residential and commercial sectors; the mild winter in the first quarter of 2012 also gave a helping hand.
Contrary to popular perception, the contribution of natural gas in the electric power sector was limited to around 26% of the total energy related CO2 reduction in 2012. Analysis of the changes in the electricity generation mix for each of the eight NERC regions in the US revealed that nearly 25-30% of the CO2 savings from coal-to-natural gas switch was offset when gas replaced zero carbon sources like hydro and nuclear. This effect was most prominent in the Western interconnection (WECC). Industries along with wind and solar had little measurable role in cutting CO2 emissions in 2012.
We discuss the policy implications of our findings.
Corresponding author: Kendyl.Salcito@CO2Scorecard.org
We are thankful to Jonathan Koomey and David Wheeler for their comments on this research note. All the views and opinions expressed in this note should be attributed only to the authors and the CO2 Scorecard Group. This research note is supported solely by the efforts and resources of The CO2Scorecard Group and the parent consulting firm Performeks LLC based in Bethesda MD, US.
Full Report
The environmental benefits of shale gas is now household knowledge. You can't turn on the TV without industry groups advertising its merits, flip through the news without the New York Times pronouncing its effectiveness or skim the blogosphere and twitter sphere without finding academics, analysts and advocacy groups lauding its achievements.
 Indeed, there is good news about emissions data – with a 205 million decline in 2012 our energy related CO2 output is the lowest it has been since 1994. The national Energy Information Agency (EIA) attributed the phenomenon primarily to the displacement of coal by natural gas. It identified reduced demand in the transport sector and the mild winter of (early) 2012 as supporting factors, but it didn't quantify their effects.
The Breakthrough Institute theorized that natural gas could take most of the credit. Since the US grid eliminated 216 million MWh of coal-generated electricity, and the US generated an additional 217 million MWh using natural gas, the displacement must have been direct.
But there's a better way to identify the role of gas than to guess at its value. The US electric grid for the forty eight contiguous states is divided into eight regions. Because some regions are heavily reliant on coal while others have a greener mix, to really know how the generation mix is changing you need to examine the changes at each NERC region.
The vast majority of electricity fed into our grids is supplied by independent power producers and traditional, regulated electric utilities. Although some small commercial and industrial units have the capability to produce electricity for the grid, their contribution is small in the EIA dataset we used.
1. Changing Generation Mix in the Electricity Sector
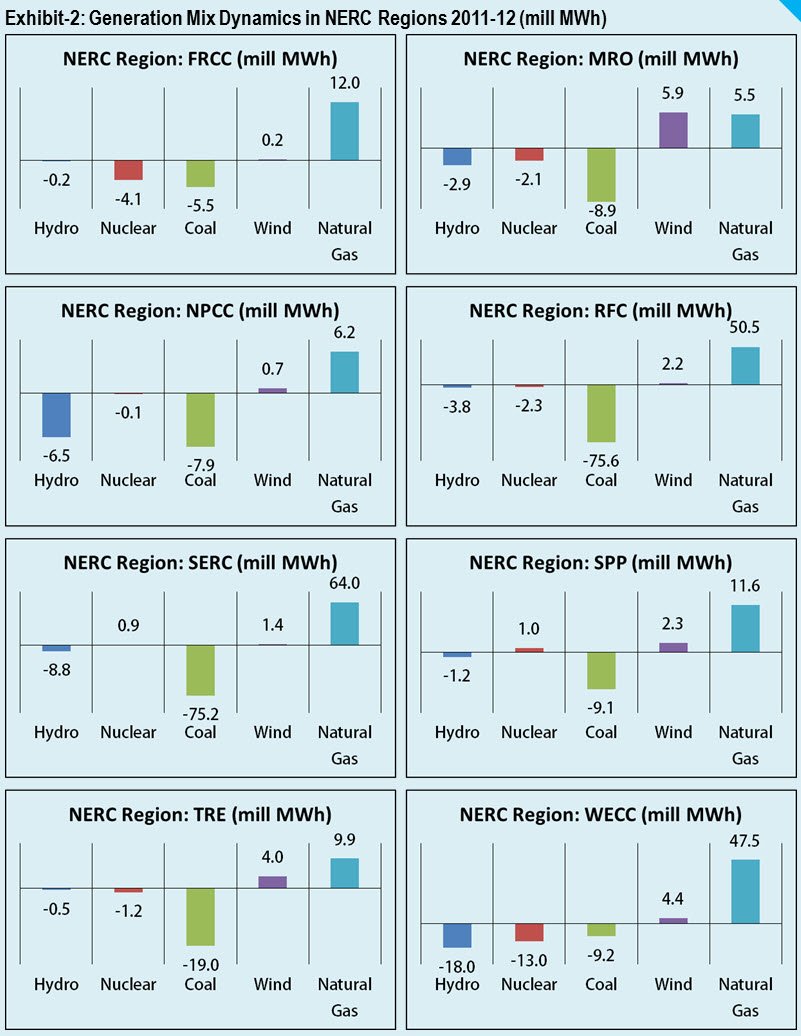
We considered the data at a national level and on a region-by-region basis to analyze the shifts in power generation. Wishing to give natural gas the benefit of the doubt, we assumed that when coal generation dropped, natural gas filled the gap to the extent it was available, followed by hydro and nuclear. The total changes for coal, natural gas, hydro and nuclear for each NERC region is shown in Exhibit-2.
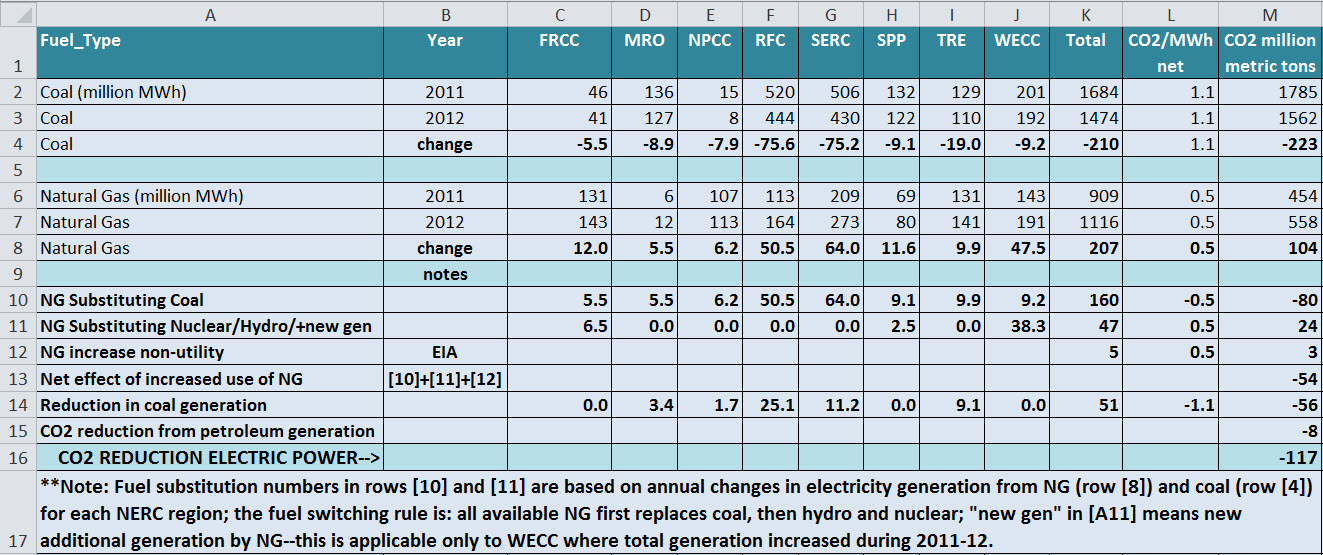
 At a national level, important nuances emerged—while 80% of the total increase in grid level natural gas (~160 million MWh) substituted for coal using our estimation methodology, 51 million MWh of coal-generated electricity was simply eliminated – people used less electricity in 2012 (Appendix-1). Energy efficiency, conservation, and the mild January, February and March of 2012 are responsible for that reduction.
At a regional level, the relationship between coal displacement and natural gas increases was even more interesting. In five of the eight NERC regions, the total decline in coal generation exceeded the total increase in natural gas generation. The grids covering the south (SERC) and central Northeast (RFC) show the greatest shift from coal to natural gas. The western grid (WECC) showed a different picture. Natural gas displaced more hydro and nuclear than coal in this region (Exhibit-2). In Florida (FRCC), natural gas substituted for coal and nuclear almost equally.
2. CO2 Reduction: Electricity Sector
2.1 Effect of Natural Gas: The impact of natural gas on CO2 emissions needs to be understood in three parts: reduction resulting from coal displacement, increase resulting from substitution of hydro and nuclear, and non-utility electricity supplied by industrial and commercial sources.
The 160 million MWh of coal displaced by natural gas represented an 80 million metric ton reduction in CO2 emissions. The hydro, nuclear and solar power replaced by natural gas represents a net increase in emissions at a rate of 0.5 metric tons for each MWh converted. The 47 million MWh of hydro and nuclear replaced by gas represents a net increase of 24 million tons of CO2. The off-grid component also increases CO2 at the rate of 0.5 tons/MWh. Between 2011-12 non-utility gas generation increased by around 5 million MWh adding around 2.5 million metric tons of CO2 (EIA MER March 2013-Table 7.2c).
When we combine the three components, natural gas accounts for a net reduction of 54 million metric tons of CO2 in the electricity sector (Appendix-1 / cell [M13]). This indicates that around 25-30% of the CO2 reduction from coal to gas fuel switching is offset by hydro and nuclear substitution.
2.2 Effect of coal, petroleum and non-hydro renewables: Additional CO2 reduction in the electricity sector comes from a decline in coal generation due to reduction in the demand for electricity, which equates to roughly 56 million metric tons of CO2 reduction (Appendix-1 / cell [M14]).
Decline in petroleum generation cut 8 million metric tons of CO2 in 2012 (EIA MER March 2013-Table 12.6). Wind and solar did not cut much CO2 in 2012 because it mostly replaced hydro and nuclear. The overall tally for electricity sector therefore shows a decline of 117 million metric tons of CO2. (Appendix-1 / cell [M16]).
3. CO2 Reduction: Transportation, Residential and Commercial Sectors
An additional 87 million metric tons of CO2 reductions were accounted for by transportation, residential and commercial sectors. The transportation sector cut 39 million tons (19%) as a result of two phenomena—people are driving less, and when they drive they tend to drive fuel efficient cars. The residential and commercial sectors shaved off an additional 48 million tons, reflecting the effects of energy efficiency, conservation and the mild winter of 2012.
4. Economy-wide CO2 Reduction
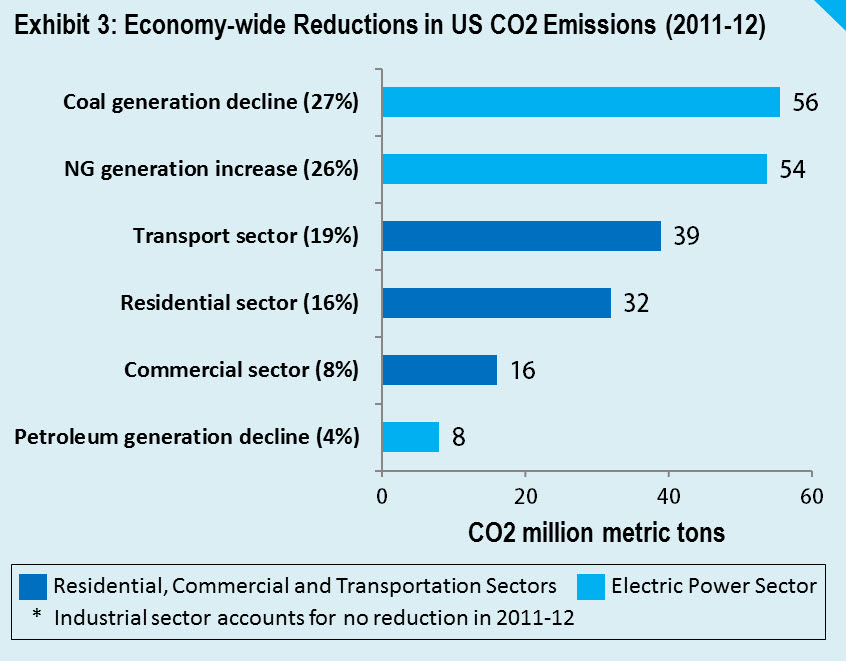 When we combine the decline in CO2 emissions in the electricity power sector with the transportation, residential and commercial sectors the total economy-wide energy related CO2 reductions comes to 204 million metric tons (Exhibit-3), which lines up well with the EIA’s estimate of 205 million metric tons for 2012.
[Note: Industrial energy consumption (excluding retail electricity) did not contribute to CO2 reductions during the period 2011-12; data on CO2 reductions in transportation, residential and commercial sectors are from EIA MER March 2013 / Tables 12.2, 12.3 and 12.5]
5. Policy Implications
Contrary to popular perception, 2012 data shows that the increased use of natural gas in the electric power sector is not the largest contributor of energy related CO2 reductions in the US over the past year. Nearly 75% of the CO2 savings are attributable to economy-wide demand reduction driven by energy efficiency, conservation and the mild winter of the first quarter of 2012.
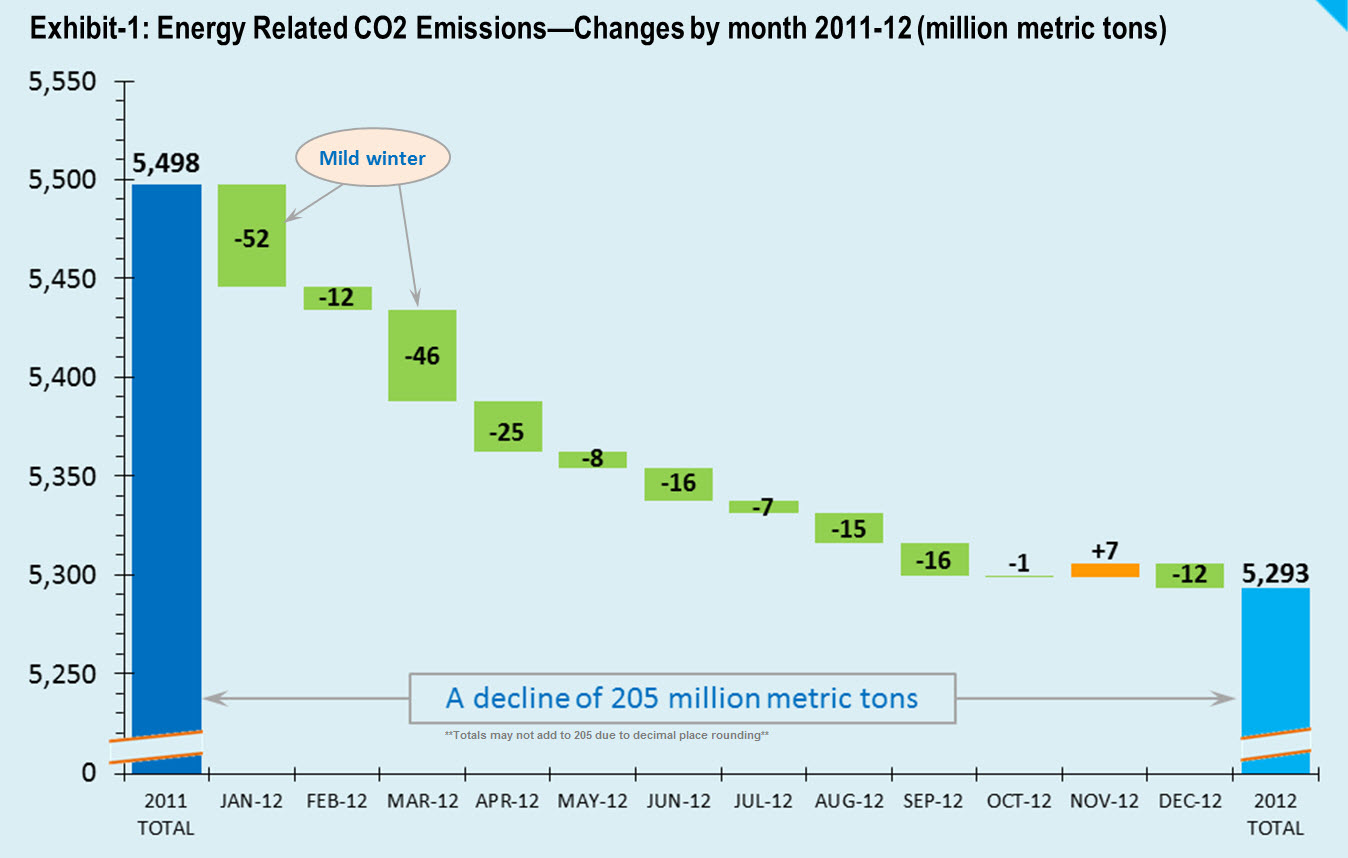
We have previously reported on the impact of warm winters, which accounted for around 45 million tons of CO2 emissions reductions in early 2012 (the effect of mild winter in Jan and Mar 2012 is visually obvious in Exhibit-1). By far, demand reduction through energy efficiency and conservation measures in the transportation, residentialand commercial sectors had the largest impact on CO2 savings (~100 million metric tons)—nearly two times more than the effect of natural gas. In addition to their significance, these changes are also likely to be 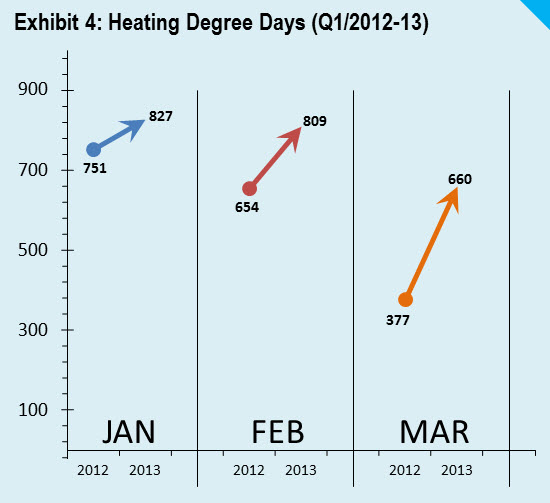 most stable.
Early energy data from 2013 show two troubling developments. First, the colder first quarter of 2013 is guaranteed to erase all weather related gains in CO2 emissions from the previous year (Exhibit-4). Second, the rising natural gas prices have seen declining gas use and rising coal use. In essence, we congratulated ourselves in 2012 for conditions that were not policy driven and are now seeing precisely how little we achieved by celebrating warm winter and cheap gas once those two conditions changed over a period of one year.
6. Conclusions
It is a mistake to assume that all increases in natural gas generation replace coal. The analysis at the level of NERC regions confirmed that natural gas also substituted zero-carbon sources like hydro and nuclear. Without a price on carbon, natural gas is likely to remain a competition for renewables and nuclear, and could suppress incentives for investments in wind and solar. On the flip side, putting a price on carbon could even help natural gas maintain an edge over coal, independent of the market trend.
 The US CO2 numbers for 2012 also refute the policy stance of groups that tend to over-state the role of shale gas (Exhibit-5) and under-state the contributions of economy-wide energy efficiency and conservation. The year 2012 is noteworthy in this respect because the US economy grew by more than 2% and its population by 0.7%, yet energy efficiency and conservation in the transportation, residential and commercial sectors were large enough to cut nearly 100 million tons of CO2. Whatever macro-rebound there was, it was nowhere close to negate the economy-wide effects of energy efficiency and conservation.
Energy efficiency policies however, remain fragmented in the US. Still the existing efforts have cut CO2 emissions by 100 million tons in 2012. This simply indicates that our energy consumption is severely bloated and the potential to cut energy use and lower CO2 emissions remains large.
The policy lesson is obvious—real and lasting reductions in CO2 come from economy-wide policy effects, not from the current transient boom in the US natural gas market. Therefore, the best way to ensure continued economy-wide reductions in CO2 emissions is through a carbon tax.
Appendix-1: Electricity Sector Calculations
 The above calculations favor the role of natural gas in cutting CO2 emissions in the electric power sector. However, under the scenario that natural gas first replaces hydro and nuclear, less natural gas would be available to replace coal. This would reduce the contribution of natural gas towards CO2 reductions. As calculated in Appendix-2, the net contribution of increased natural gas generation in the electric power sector could shrink to under 40 million metric tons of CO2 (20% of the total 2012 reductions). Detailed calculations for this scenario are available in Appendix-2.
Data Notes
1. As explained in the text we are primarily concerned with coal and natural gas generation that is available for fuel-switching. Therefore, our analysis uses data on electricity generated in the electric power sector (regulated utilities and independent power producers) where coal and natural gas generated 1,502 and 1,138 million MWh respectively in 2012 (source: MER March 2013 / Table 7.2b / Fossil Fuel columns “Coal” and “Natural Gas”).
Our methodology required us to dis-aggregate the total net generation by coal and natural gas into eight NERC regions. Data on net generation, fuel type and NERC regions come from EIA’s Form-923. For the year 2012, the data set includes sampled data for nearly 2,000 generation plants and estimated for the remainder of the out-of-sample generation plants (~3,800 largely small units). The sampled power plants are typically large and they account for approximately 98% of the total generation in the electric power sector estimated by the EIA for 2012. Our analysis is based on the data of these ~2,000 sampled units.
The total generation in 2012 for coal and natural gas power plants based on the sampled units in Form-923 adds to 1,474 and 1,116 million MWh respectively (see cells [K3] and [K7] in the above table). To analyze the change during the period 2011-12, a matching data set was identified for 2011 using Form-923.
After the end of the calendar year, the EIA collects data from the out-of-sample plants. A complete 2012 data file (including all accepted plant data) is expected to be published in late summer or early fall of 2013.
2. Given the current status of the EIA data, we validated our analysis with the USEPA's Acid Rain Program (ARP) reporting, which logs hourly gross electricity generation and CO2 emissions from all fossil fuel based utility units with at least 25 MW capacity. We use 5% and 2% adjustments to convert gross to net generation for coal and gas units respectively, and applied USEPA’s data to validate our results from the EIA’s data.
According the USEPA’s ARP data, natural gas and coal generation from utility units added 1,508 and 1,021 million MWh in 2012. The EIA’s and USEPA’s numbers for coal generation are almost identical (1,502 and 1,508 million MWh). However, for natural gas generation USEPA’s total is 10% lower compared to the EIA’s total of 1,138 million MWh for the electric power sector. USEPA’s data implies that less of natural gas generation was available to substitute coal. As a result, USEPA’s data shows that the effect of fuel switching from coal to gas contributes approximately 21% of the total energy related CO2 reduction of 205 million metric tons (data available on request). As presented in the research note, EIA’s numbers show that natural gas in the electricity sector accounts for 26% of the total energy related CO2 reductions. At this stage, it is hard to pin point the source of the difference in the EIA and USEPA numbers for natural gas generation, and it will be a subject for future research.
Additionally, the numbers for CO2 emissions per MWh of net generation are from USEPA’s ARP database. We computed these numbers for 2010, 2011 and 2012—all the three years had nearly identical numbers. Accordingly we use 0.5 and 1.06 metric tons of CO2/MWh net generation for natural gas and coal respectively. Because of the decimal place rounding, the number for coal generation displays as 1.1 in the calculation table shown above.
3. Our analysis excludes adjustments for inter-regional transfers because it accounts for a small amount of electricity. According to the EIA:
“The West receives very small amounts of power from the East. The East and the West operate as separate electric systems, called Interconnections. The ties between the transmission systems in the East and West have very limited capacity for power transfers. The significance is that the Eastern and Western interconnections (and a third interconnection covering most of Texas) are for most purposes electrically isolated from each other. Each interconnection is operated independently, and trade between the interconnections across the direct current ties is minimal.
In 2010, the EIA estimates that the inter-regional transfer was less than 1%. There is no data that shows that the situation in 2012 was any different. Therefore, excluding the adjustments for inter-regional transfer will not affect our findings and conclusions.
4. Our text highlights the transient nature of the mild winter during the very short period of 2011-12, but there are two long-run climate factors to consider: (1) the downtrend in heating degree days from global warming, which reduces energy demand; and (2) the uptrend in cooling degree days (from the same source), which increases energy demand (for air conditioning). The balance may favor reduced energy demand—but that will become clearer in the coming years.
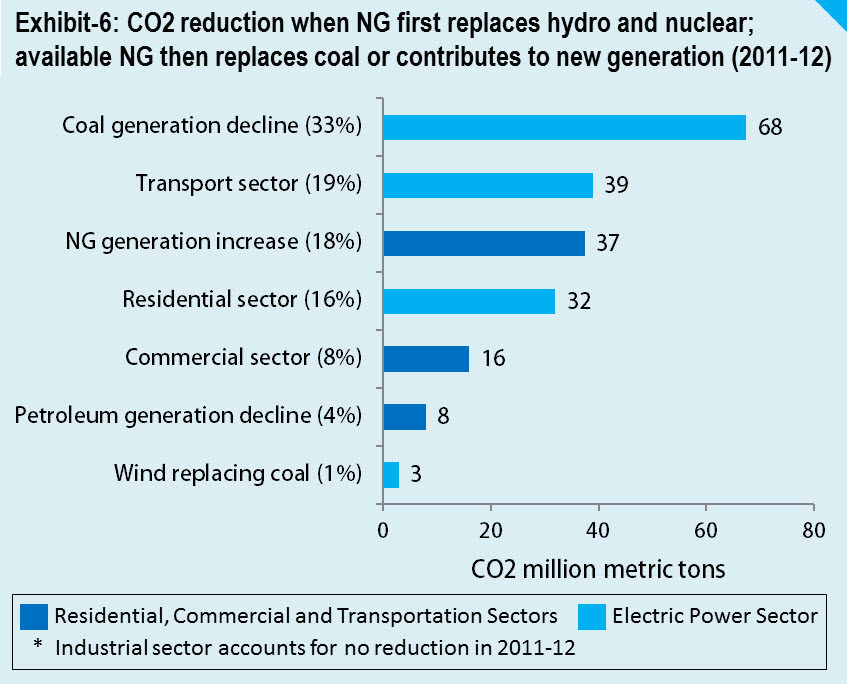
Appendix-2: CO2 reduction when NG first replaces hydro and nuclear; available NG then replaces coal or contributes to new generation
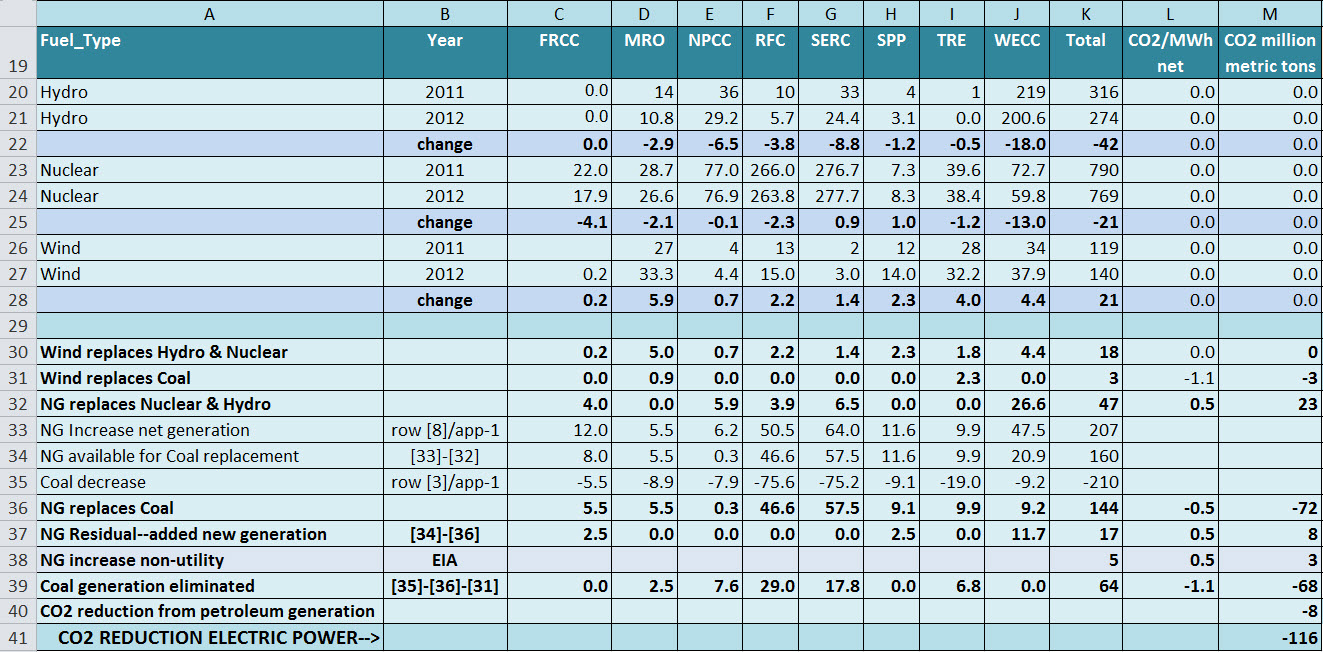
Under the scenario shown above, nearly 40% of the gains in CO2 reductions from coal-to-natural gas shift is offset when increased use of gas substitutes hydro and nuclear, and/or adds to the new generation. When we combine the decline in CO2 emissions in the electricity power sector under this scenario with the transportation, residential and commercial sectors the role of natural gas in the total economy-wide energy related CO2 reductions shrinks to just under 20% (Exhibit-6).