Site Feature: Using a treemap to analyze relative values of CO2 indicators
Written by: CO2 Scorecard Research • Apr 20, 2010
Topic: Site Feature
Treemaps are a very useful analytical tool to quickly identify relative size and patterns in data. They use area as an indicator of relative size, and color to indicate rate of growth of a particular indicator.
For example in reviewing the top emitters in the global economy, an analyst could compile a ranking such as the list below, which ranks countries by their overall CO2 emissions from fossil fuels in 2008:
| Carbon Dioxide Emissions from Fossil Fuels |
| Data from CDIAC, US Dept. of Energy |
| Rank |
Country |
2008 Emissions, million metric tons |
| 1 |
China |
7.049.85 |
| 2 |
USA |
5,674.02 |
| 3 |
India |
1,756.48 |
| 4 |
Russia |
1,595.45 |
| 5 |
Japan |
1,310.96 |
| 6 |
Germany |
771.76 |
| 7 |
Canada |
563.42 |
| 8 |
United Kingdom |
545.67 |
| 9 |
Korea |
521.51 |
| 10 |
Iran |
491.19 |
The same information could be displayed using a treemap, which will give a visual representation of the relative size of each country’s carbon dioxide footprint as well as the rate of growth. This type of tool allows for very quick analysis of the pattern of distribution within various indicators.
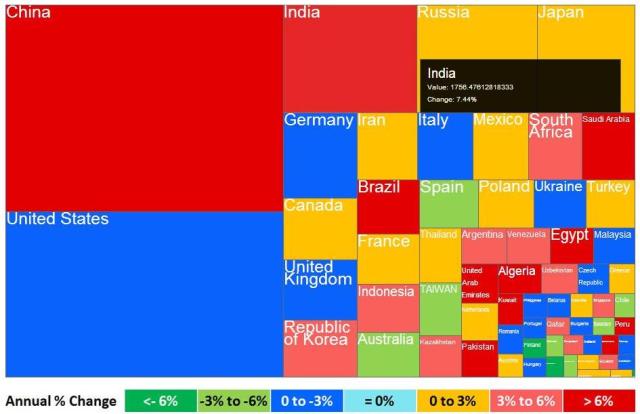
For example, it is very clear in the screenshot below how much larger China and the US’s footprint are relative to all other nations, a realization that takes an “extra step” in a pure ranking format as the one above. In addition, within the CO2 Scorecard data platform a user can highlight a particular country to reveal a pop-up window with the specific figures underlying the visual representation in the treemap diagram. The attached diagram demonstrates this feature as well (in this case, showing India’s emissions and rate of growth).
Fig. 1: Treemap of Total CO2 Emissions from fossil fuels, 2008 (million metric tons)
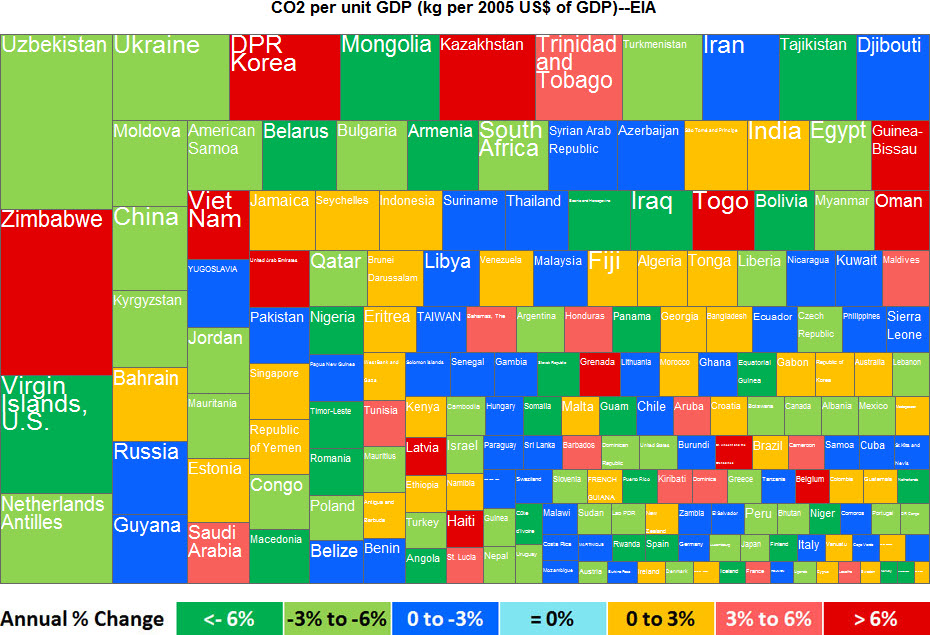
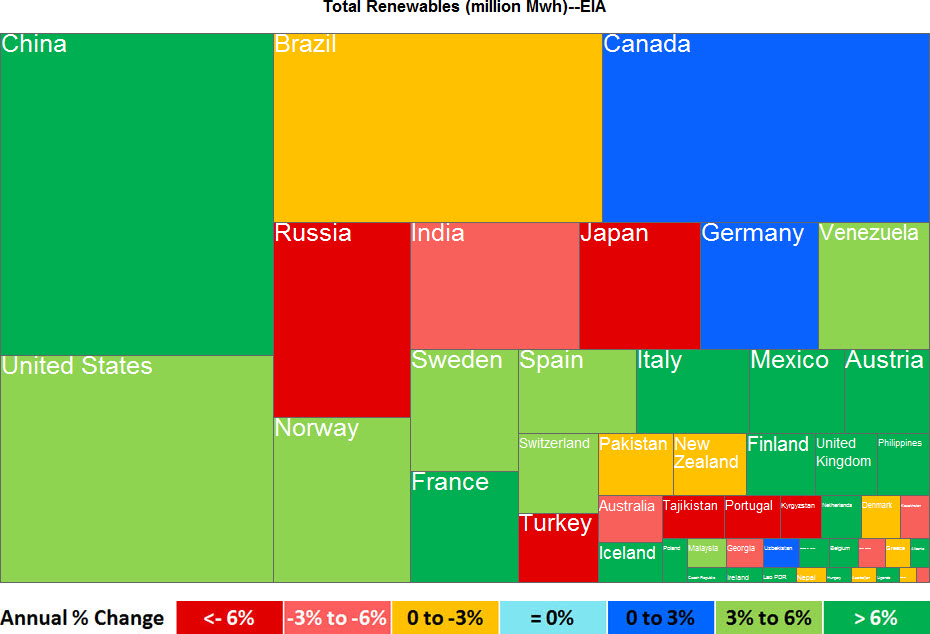
At the same time you can visualize the data on CO2 intensity, which shows a comparatively even distribution relative to CO2 emissions. With a few mouse clicks a user can easily identify the countries that are the most prominent users of renewable energy sources (see screenshots below). Or visit CO2 Scorecard's treemap page and explore the data yourself.