CO2 Scorecard Grading Methodology
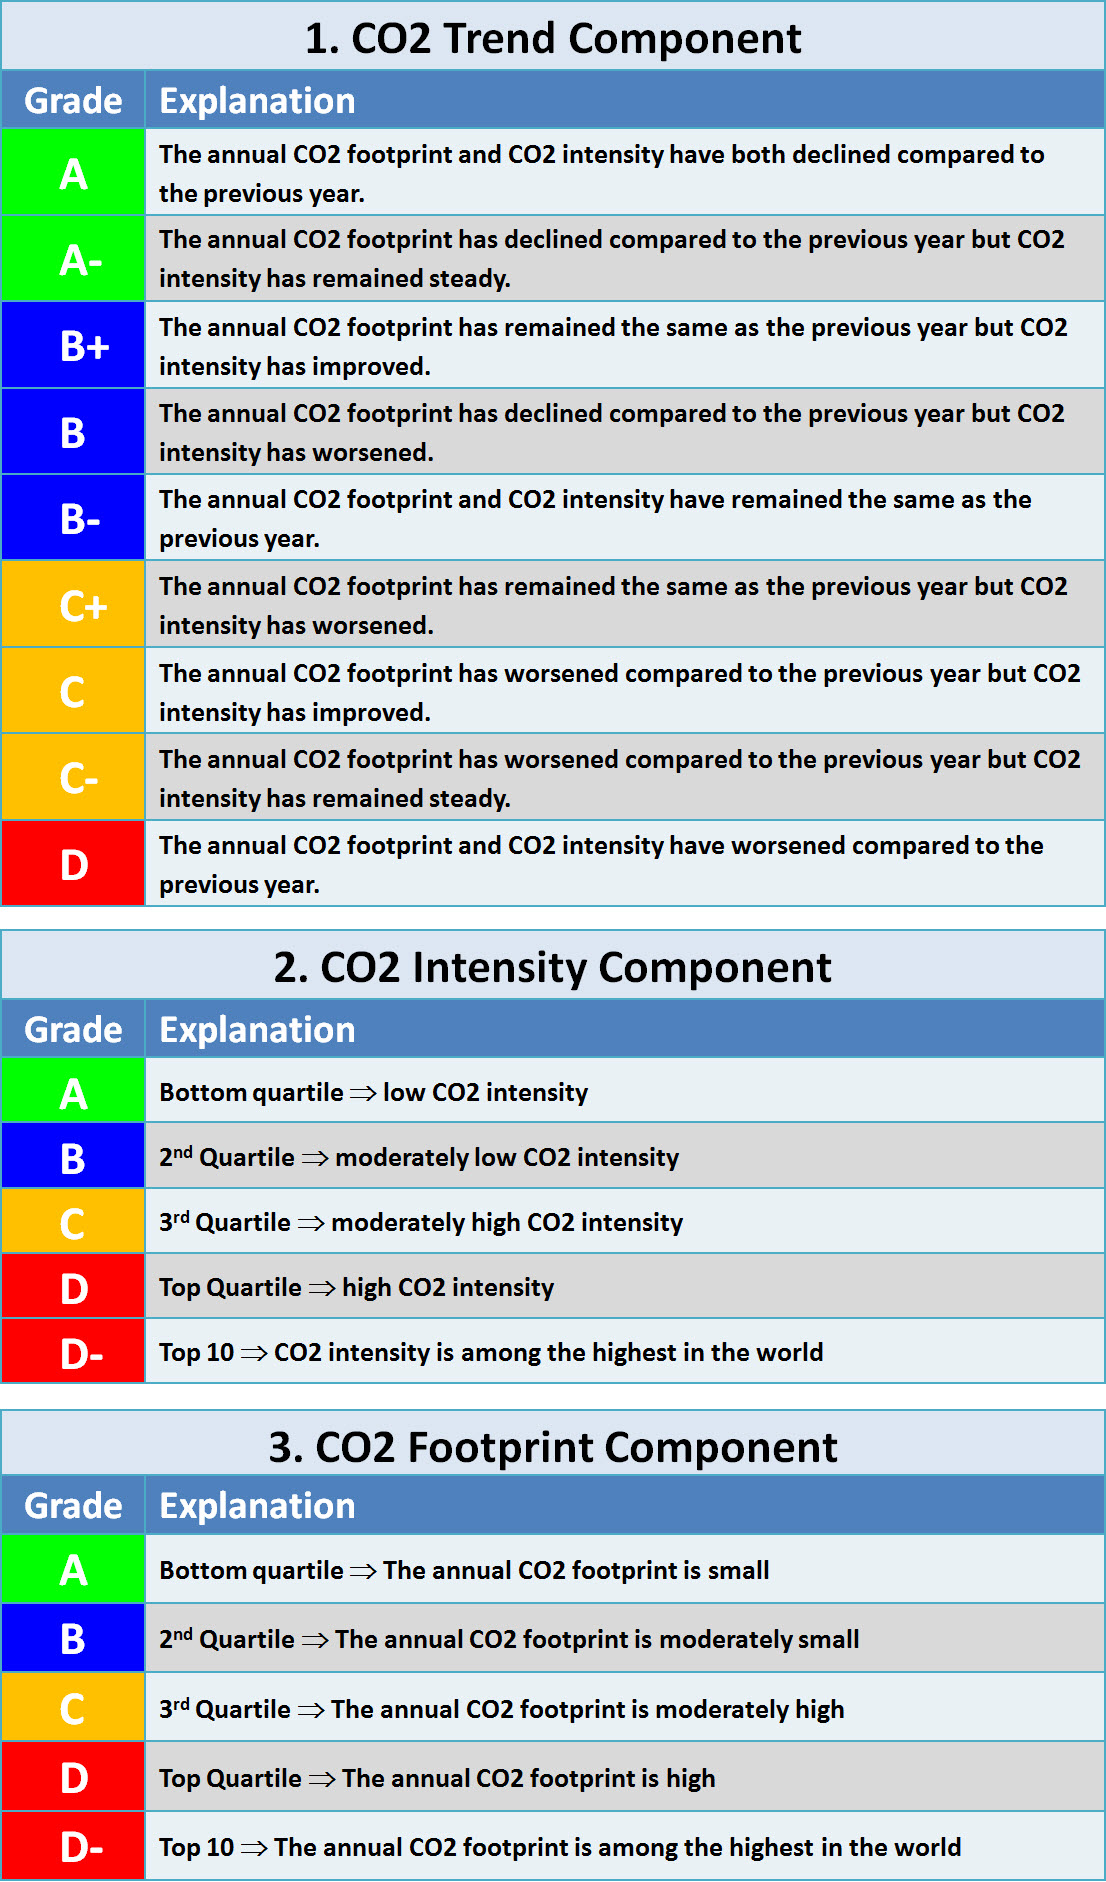
The grading approach used by CO2 Scorecard aims to capture three dimensions of CO2 emissions performance. These are: (1) the annual trend of CO2 emissions, (2) the CO2 Intensity of the economy measured in terms of kg of CO2 per 2005 PPP GDP (source: EIA-US) and (3) the CO2 footprint as measured by the total annual CO2 emissions from energy use (source: EIA-US). CO2 Scorecard does not intend to further aggregate these components into a single index.
The cut-off points and the grading criteria for the three components of the overall rating are shown below, and the underlying mathematical and statistical concepts are explained later in this note.


[Note: The quartiles displayed on the country dashboard are based on nonparametric or distribution free methodology. In comparison, the quartiles for grading are estimates based on the assumption of lognormal distribution.]


For further clarifications and supplemental information please contact us.