Did Energy Efficiency Break the Electric Utilities' Business Model?
Written by:
Shakeb Afsah,
Nicola Limodio and
Kendyl Salcito • Mar 19, 2015
Topic: energy efficiency; electric utilities
Summary
We have reached a tipping point in America’s power sector. An industry that has sustained itself on Americans’ growing power demands has suddenly seen demand drop. This is making it difficult for US power utilities, under their current model, to turn a profit. What’s more, this is not a new trend. Using a time-series filter, an analysis of forty years of monthly end-use electricity data exposes a twenty-five year trend during which energy efficiency has steadily chipped away at the total electricity use in the US.
This would signal a pending contraction of the power generation sector, but seasonal, cyclical fluctuations are making it impossible for power providers to scale back. Increasingly warm summers in the US, combined with a demographic shift towards warmer states, have caused demand for electricity to actually increase during peak seasons.
The two diverging long-term patterns—falling electricity use and the increasing peak load—create a perfect storm for the finances of utility companies. While warmer summers require utilities to maintain generation capacity, warmer winters and energy efficiency starkly reduce demand the rest of the year, cutting into utility companies’ cash flow and bottom line.
This may be good news for consumers who watch their electricity bills drop, but it’s a real problem for power companies. If trends persist, they will be forced to increase the price of electricity to cover costs. But increased price will only strengthen the incentives for more electricity conservation and boost the demand for rooftop solar with net metering.
We see this action-and-reaction as a disruptive force that could trigger radical reform of the power sector’s obsolete business model.
Authors
Shakeb Afsah and Kendyl Salcito are with the CO2 Scorecard Group; Nicola Limodio is a doctoral candidate at the Department of Economics at the London School of Economics. He is a former Junior Professional Associate at the World Bank.
Acknowledgments
We are thankful to
Danny Cullenward, a Philomathia Research Fellow at Berkeley,
Jonathan Koomey from The Steyer-Taylor Center for Energy Policy & Finance at Stanford and
Amory Lovins of Rocky Mountain Institute for their valuable comments and insights on this issue. All the views and opinions expressed above should be attributed only to the authors and the CO2 Scorecard Group.
Continue reading or download
Introduction
Conventional wisdom has it that electricity consumption in the US follows economic growth. But since the great recession of 2008, this link has snapped. The contraction of the US economy cut deeply into US electricity use, but it was assumed usage would rebound in tandem with the economy. We are now well past the recession, but the total electricity demand has remained tepid, causing considerable financial anxiety for power utilities. Between 2007 and 2012, four years out of five showed declines in electricity use.
The recent decline in the US electricity demand is a big deal, and it hasn’t gone unnoticed. As early as Aug-2012, energy experts started to brief Wall Street investors about the demand destruction going on in the electricity sector. By Sep-2012 Platts saw “something real” in the effect of energy efficiency on power demand. Soon the Brattle Group and The Wall Street Journal followed suit with their coverage. A year later, the US Energy Information Administration (EIA) was echoing the reports, which have proliferated in The Washington Post, ACEEE and, again, the Wall Street Journal. Most recently CleanTechnica singled out energy efficiency as the most persistent factor behind the falling electricity use.
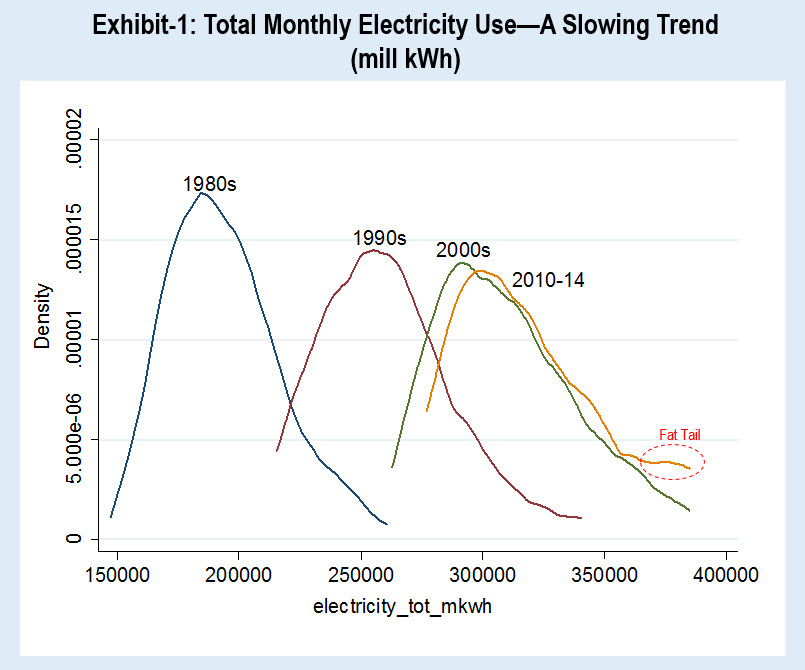
Our analysis confirms this trend, dating it back for more than twenty years. Decade by decade, electricity demand has increased less and less, until finally it has approached stagnation. As shown in Exhibit-1, the decadal increase in electricity use was considerably smaller between 1990s-2000s compared to 1980s-90s. And there was hardly any increase between the 2000s consumption and what the monthly figures for electricity use show for the current decade of 2010. Electricity consumption has been growing for decades, but the rate of growth has been steadily declining.
The analysis depicted in the exhibit reveals a second trend—a fat tail caused by spikes in the summertime cooling needs. While overall energy demand increases have been shrinking, it appears that the seasonal demand corresponding to warm summers has been rising. There is a distinct emergence of very high seasonal electricity consumption in the 2010s—suggesting that the intensity of peak load has gone up in recent years. We dig into these numbers in more detail.
Energy Efficiency Emergence
Energy efficiency policies have a 40-year history in the United States. Unsteadily, green policies and programs have grown both nationally and at the state level, even as the annual energy efficiency scorecard shows how unpopular energy efficiency programs remain with many state regulators. Florida, Indiana and Ohio have actually scaled back their efficiency measures (BNEF 2015). But even in this highly sub-optimal policy environment, bit-by-bit the small savings in electricity use have accumulated over time, leading us to the point of momentous change.
There is a broad consensus among analysts and policy makers that energy efficiency has played a major role in energy savings. This near unanimity has, ironically, given prominence to dissenting opinion from contrarians. With the case for energy efficiency so well proven, against-the-grain theories have natural allure. Often, the contrarian views are promoted through research that is flawed, as Nature Magazine has documented.
There’s nothing hip or new about energy efficiency. The US government has prioritized energy efficiency since 1975, with the passage of the Energy Policy and Conservation Act. Several policy and program upgrades later, there is plenty of evidence to show that energy intensity in the US is falling—particularly in residential and commercial sectors. But the critics of energy efficiency point to the rising total energy consumption to argue that energy efficiency is not good enough for climate management; they say it cannot offset the effects of factors that tend to increase energy consumption.
The appeal of alternative theories is heightened by the fact that proving energy efficiency’s effectiveness requires counterfactual analysis, which is difficult to flesh out in journalistic writing. Counterfactuals involve hypothetical scenarios. How do you prove that, but for the intervention that was implemented, things would have been different?
For example, during the recent recession, the economy continued losing jobs for several years even after the Economic Stimulus Act of 2008. This was perceived by many to mean that no improvement was occurring, but statisticians saw that fewer jobs were being lost month-over-month. Job losses hit an inflection point in 2010, and only then did the public recognize improvement trends. The counterfactual, that but for stimulus programs and state intervention, job loss rates would have remained unchanged and a recovery would be impossible, did not prove itself until the recovery occurred.
US electricity consumption has followed a similar path. For the longest time, electricity use has been growing but at a slower pace every year. But that was not convincing enough to prove that energy efficiency was working. That changed when total electricity consumption stopped growing recently—a turning point reached after 25 years of almost imperceptibly slow declines in the growth of electricity consumption.
Methodological Considerations
According to the USEIA, around 75% of the electricity in the residential sector is used for day-to-day activities. What’s more, our day-to-day activities involve a proliferation of electricity uses. From putting bigger refrigerators into bigger houses, to doing more laundry or watching bigger TVs in our better-lit basements, to plugging in more smartphones and iPads, the American lifestyle lends itself to perpetually increasing electricity use. Price also influences electricity consumption, and the real price of electricity declined from 1982-2004 (since 2004, the average national real price has remained mostly flat to minimally up). Meanwhile, our bigger houses require more electricity for heating and cooling. Here, America’s (and the globe’s) warming trend requires more electricity for air conditioning in summer months. This effect is amplified by a steady demographic shift to the American south and west.
The same is true in the commercial sector. Offices are getting bigger and more techy. Old warehouses have been converted to hip open work spaces, which require more powerful lighting, cooling, ventilation, refrigeration, powering office equipment, and space and water heating.
Against that tide, energy efficiency and conservation are pretty much the only drivers of electricity use reduction. That’s where the long-term electricity demand trend comes into the picture.
To identify the true effects of energy efficiency, we need to look at both the underlying long-term trends and the short-term cycles and irregularities. Therefore, an analytical tool was needed that could “smooth” out the irregularities to show broad change over time. Accordingly, we turn to the business cycle literature in economics and apply what is known as the Hodrick-Prescott (HP) filter—an economic tool to separate a time series into long-term smooth trend and short-term cyclical and irregular components (see Technical Appendix). We apply this filter to the USEIA’s monthly electricity end use data from January 1973 to November 2014[1].
Results
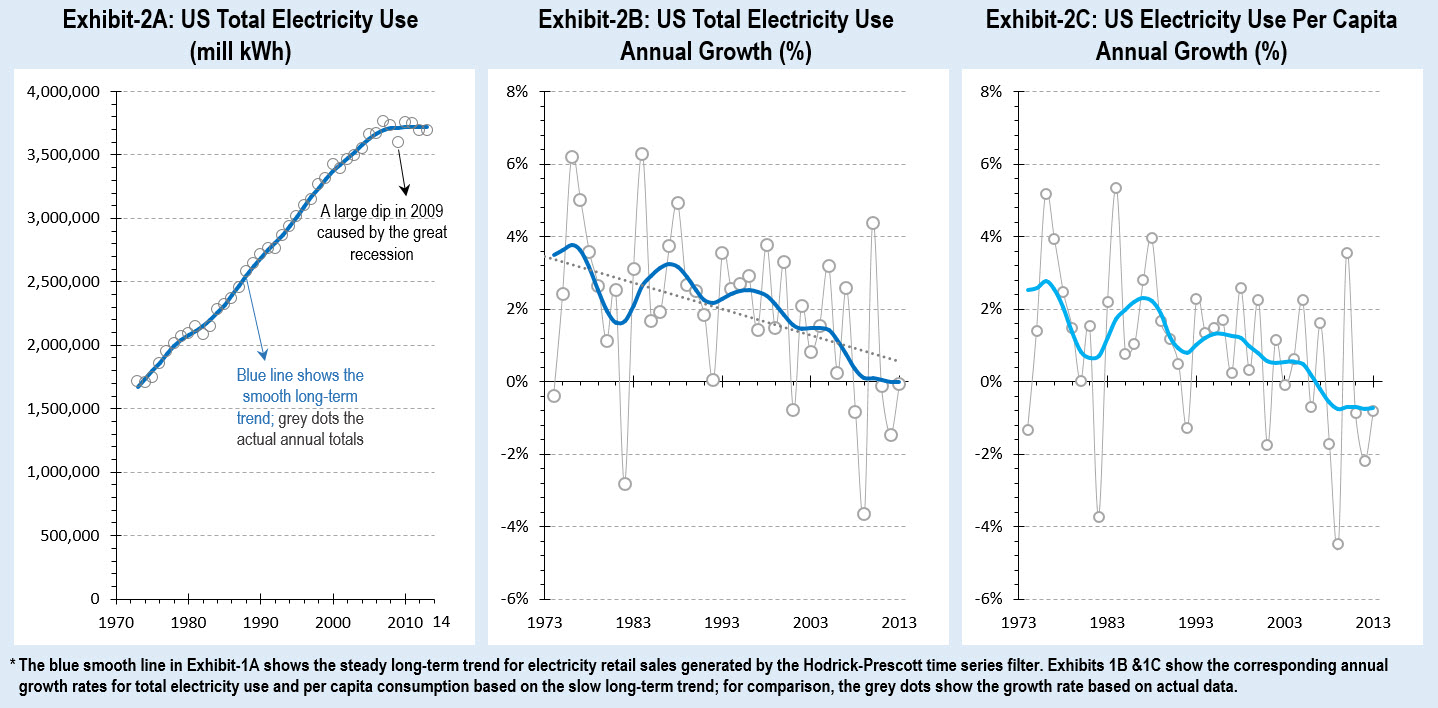
Exhibit-2A shows the HP filter accurately tracing out the actual annual total consumption of end-use electricity in the US. At a glance, it looks like a steady increase that begins to change course in 2009 and staying flat thereafter.
The other statistic we are interested in is the annual growth rate of electricity consumption and how that has changed over time. This is plotted in Exhibit-2B and it underscores the importance of separating out the smooth trend from the cyclical and irregular components; it shows the comparative annual percent change in electricity consumption with and without the cyclical fluctuations. The smooth, year-over-year change (as shown by the blue line in the chart) clarifies the decline in the long-term trend. In 1988 electricity use was increasing at a rate of 4% per year. From 1989 onwards, that rate started to steadily decline. It took more than twenty years until the annual increases in electricity use came to a halt.
While the growth of total electricity use appears to have halted only recently, the per capita electricity use hit zero-growth in 2006 and continues to decline at around -0.7% per year (Exhibit-2C). Since per capita energy consumption actually started contracting prior to the recession, it is likely to be a well-formed trend—which suggests that total electricity use (accounting for population growth) may also see negative growth trend in the coming years.
The Drivers of the Trend
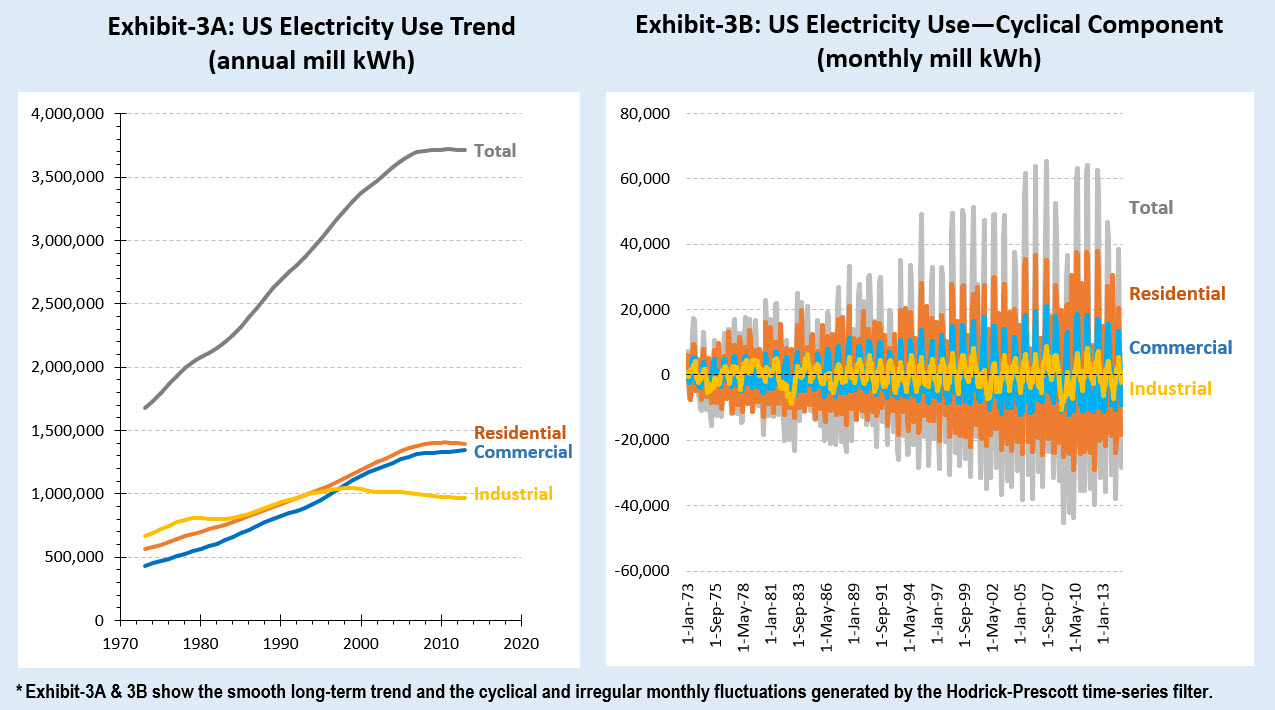
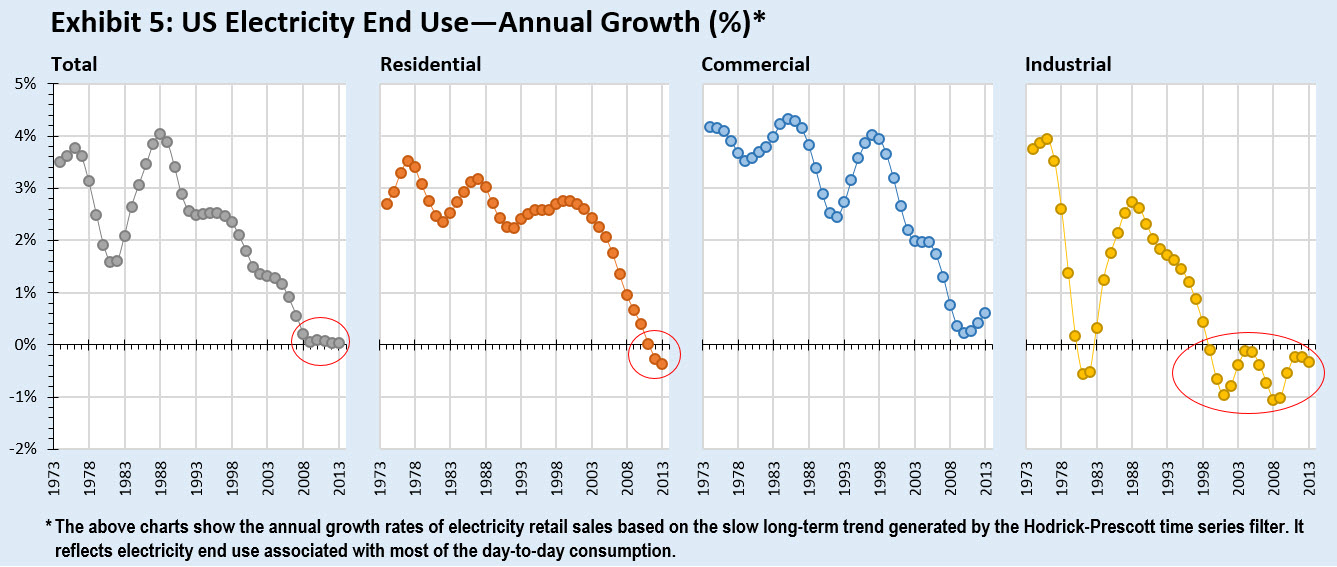
To better understand the drivers behind these dynamics, we analyze the electricity use trend and monthly cyclical components in residential, commercial and industrial sectors. These are plotted in Exhibits-3A & 3B.Three key insights emerge: (1) the growth of electricity demand slowed beginning in 1988, in the industrial sector; (2) the growth of electricity use in residential and commercial sectors began to decline around 2000,a few years after the USEPA’s Energy Star program started; and (3) the size of the cyclical component increased over time (Exhibit-3B), correlating to data depicting the warming climate, a demographic shift to the south and west, and the ballooning size of the US homes and commercial buildings.
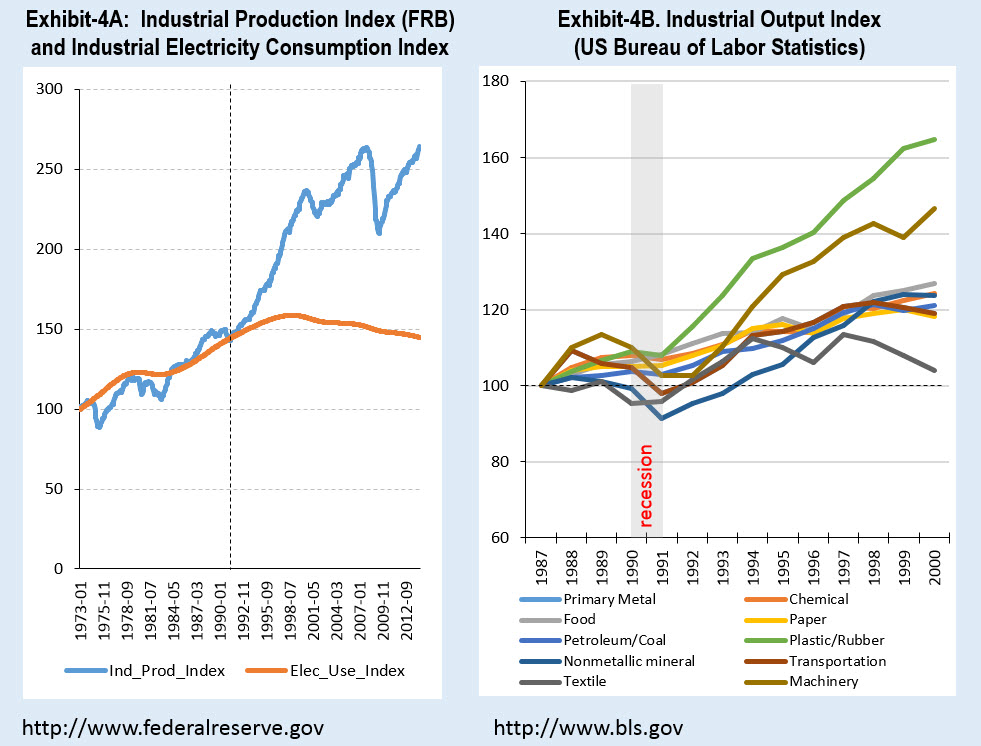
(1) Industrial Sector: The most interesting period in industry’s electricity use is 1988-2000, when annual growth in total electricity use started to slow. As shown in Exhibit-4A, industrial electricity use and output moved in tandem until the end of the 1980s. Decoupling from industrial output started in the 1990s, suggesting that industry contributed to the slowdown in the national electricity growth rate.
It is not immediately clear why this shift occurred. Industrial composition could be a factor, but the analysis of the seven industries that consistently account for the majority of the sector’s electricity use (chemicals, primary metals, food, paper, petroleum and coal, plastic and rubber, and non-metal construction materials like cement) show little change in our industrial makeup over time. In 1991, when the EIA surveyed the manufacturing sector, those seven sectors accounted for 73% of industrial electricity use. Their share remained more or less the same in subsequent surveys in 1994, 1998 and 2002.
Next we considered the possibility that manufacturing output itself had declined during that period, as the economy grew more service-oriented. We checked output trends in the annual index of output reported by the Bureau of Labor Statistics (BLS)[2]. As shown in Exhibit-4B, there was a dip in output during the recession of 1991, but that quickly reversed and output continued to steadily grow for all the seven electricity consuming industries until 2000.
Since neither industrial composition nor output changes can explain the decline in the sector’s electricity consumption, a significant measure of credit is likely owed to energy efficiency. In 1975 the Department of Energy started collaborating with companies, offering tax breaks and technical support to cut their electricity use, as part of a federal energy efficiency program. Soft law was reinforced with firmer regulation with the 1992 passage of the Energy Policy Act, which established mandatory standards on electric motors used in industry. These measures led to improved processes, adoption of information technologies to enhance productivity, more efficient motors and better management practices that cut industrial electricity use.
After 2000, energy efficiency and output effects cut industrial electricity use by around -0.5% per year. However, industry’s impact on the national trend diminished considerably over time, because industries accounted for a declining percentage of the total electricity demand (25% at present). The recent trend, therefore, is driven primarily by residential and commercial sectors.
(2) Residential and Commercial Sectors: The 1992 launch of the EPA’s Energy Star program was a game changer for domestic energy efficiency. Energy Star is a federal program to certify energy efficient consumer products as well as commercial and industrial buildings and operations. Its labelling program includes lighting, personal computers and monitors, printers, fax machines, dishwashers, clothes washers, refrigerators, audio and DVD equipment and water coolers—the range of products that account for the bulk of the day-to-day electricity consumption. These efforts enjoyed an additional boost in 2001 when the EPA and Energy Star launched a national public awareness program to encourage energy-efficient behavior. As of 2012 it is estimated to have saved $230 billion in energy bills and eliminated more than 1.8 billion metric tons of greenhouse gas emissions.
During Energy Star’s awareness program, between 2000 and 2007, the US economy continued to grow, and the electricity consumption in residential and commercial sectors continued to increase, but at a slower rate every year. Exhibit 5 shows that the growth rate of commercial and residential electricity use started to decline around 2000. The timing allows for a slight lag between the program’s start and improvements in efficiency, due to the inevitable delay of policy implementation as old light bulbs, ventilation systems and appliances were phased out by new and more efficient ones.
Then came the recession, and the US economy contracted from 2008-09. This caused a dip in electricity demand, as shown Exhibit-1A. The time series filter treats it as an irregular fluctuation, so is not reflected in the slow trend. It was only around 2011-12 that the annual growth rate of electricity demand began to stagnate, poising it for a decline in the near future. Energy efficiency gains in the residential sector, combined with the reduced electricity use in the industrial sector, are cutting overall consumption and is large enough to offset the electricity use in the commercial sector which continues to grow at a meagre 0.5% a year. The dynamics for commercial sector could change in the coming years as energy efficiency gains further traction from the forthcoming Clean Power Plan.
The historical and ongoing demand destruction is remarkable, occurring despite the counter effects of a growing population, higher incomes, bigger houses, more lighting and larger appliances.
(3) Cyclical and Irregular Fluctuations: The cyclical component of the electricity trend data provides important insights into how climate change and demographic shifts interact with the electricity sector. As shown in Exhibit-3B, these seasonal fluctuations appear to be increasing over time. Exhibit-6 plots those fluctuations by months to clearly chart the growing spread between the months when electricity demands are highest and lowest.
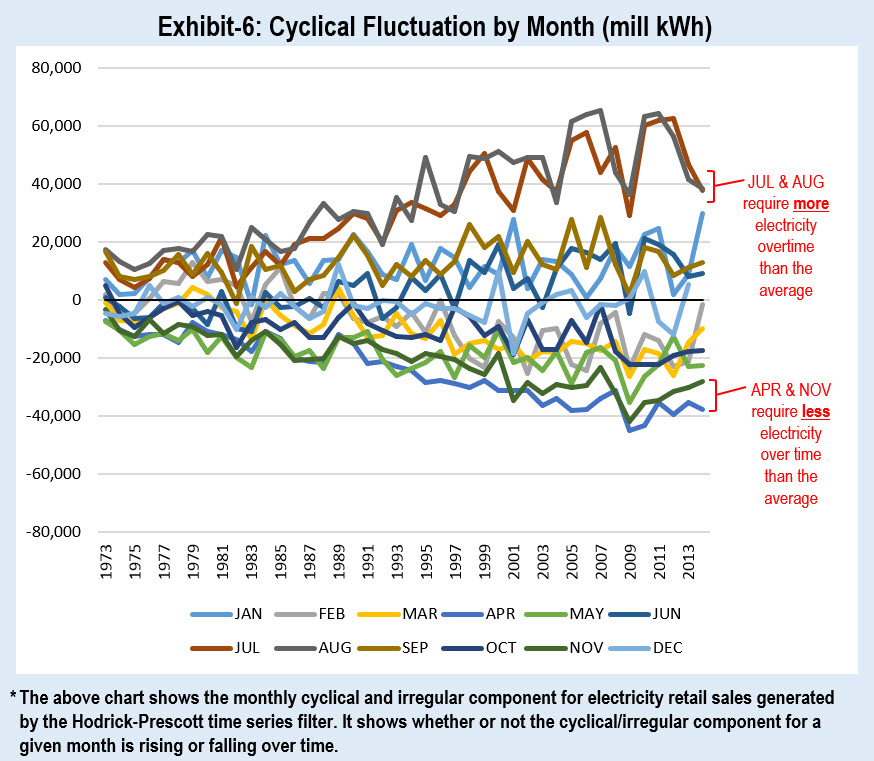
The upward trend in electricity usage for the months of July and August reflects the rising use of air conditioning. This trend coincides with two recognized changes occurring in the US. First, there has been a steady demographic shift to the warmer south and west. Second, summers have been becoming steadily warmer due to climate change. The combination of the two plays a key role in increasing the demand for electricity during the summer months. Simultaneously, median household size is on the rise – individuals require more energy to cool more space, just to achieve the same level of comfort they would have experienced in a smaller home. While it is difficult to pin-point when Americans will stop seeking more living space, there is very clear evidence that hot summers will continue growing hotter. Therefore, the trending rise in peak load demand in summer months is likely to persist.
But global warming is expected to make other months warmer too. As shown in Exhibit-6, this appears to be the case with the months of April and November, which are not as cold as they used to be. This effect contributes to reducing electricity consumption. However, cooling in the summer consumes nearly 1.5-2 times more electricity than heating during the winter because space heating is primarily fueled with natural gas, with only secondary effects on electricity consumption. As a result, on net, the warming trend and the demographic shift tend to increase the overall peak electricity use.
This warming trend masked the full impact of energy efficiency on day-to-day electricity consumption until cyclical and irregular fluctuations were separated from the slow trend component in the time series data.
Implications for Power Utilities
The combined realities of rising peak demand during summers and declining demand for everyday needs means the electricity sector will soon face tough decisions. The New York Independent System Operator (NYISO), which operates New York’s 11,000 miles of high-voltage transmission, sees implications for “system planning, grid operations, wholesale electricity markets, and demand-side management programs.”
Dr. Amory Lovins of the Rocky Mountain Institute has stated the problem succinctly: “Higher peak loads require investment (under the old business model) not only in generation but also in distribution, which typically costs even more nowadays.” That is only half the challenge: “meanwhile, many utilities face a lot of catchup investment for deferred maintenance, environmental cleanup, and grid security fixes.”
With the worsening warming trend, peak load will continue to outpace the growth in the overall consumption of electricity. At the same time energy efficiency will only gather more steam as old commercial buildings and residential units are replaced by new units. New policies will have a similar effect—most notably the EPA’s Clean Power Plan, which relies heavily on energy efficiency measures to cut electricity use.
This has major financial implications for electricity companies, because significant investments are needed to maintain peak generation capacity. Most of the industry’s operating costs must be covered by billing day-to-day usage, since peak flow periods are so brief. As day-to-day usage declines, electricity companies will likely need to boost tariffs. Such price hikes are likely to trigger demand declines. This dynamics is a financial nightmare for power utilities. The Columbus, Ohio-based American Electric Power Company CEO told the Wall Street Journal, “It’s a new world for us.”
Policy Implications
The US electricity sector remains a bastion of fossil fuel consumption, with institutional roots and incentives that are hard to dislodge. But the combination of three factors—energy efficiency, the warming trend and the falling cost of renewables—is reshaping the sector. These trends create a triple threat to the viability of power utilities as they currently operate.
Utility companies in Hawaii, Texas, Arizona and Louisiana have launched efforts to eliminate or reduce the credits that utility customers received for using rooftop solar systems. Oklahoma actually made efforts to charge utility customers for installing off-grid clean energy. And Florida cut its energy efficiency goal by 90%. These protectionist measures present major barriers to both the adoption of energy efficiency measures as well as the modern solar and wind technologies. But they are strategies in a losing battle in a lost war. Energy efficiency has worked at the national level despite the halfhearted support it has received in many states. Industrial opposition to renewable resources may slow the revolution in US power generation, but it is very unlikely to stop it.
The disruption we see today in the electric power sector was triggered by energy efficiency more than twenty years ago, and the recent success of rooftop solar power is clearly having a multiplier effect on the urgency to reform and modernize power generation in the US. These forces are nudging the sector to a point where power utilities have little option but to strengthen electricity conservation and shift to renewables. Some are already moving in this direction.
What happens in the US electricity sector has global implications for CO2 emissions. As efficiency measures and renewables take hold in the US, developing countries can draw an important lesson: avoid getting locked into a fossil-fuel electricity generation infrastructure. Adopting energy efficiency programs, and solar and wind installations, early on in the economic development ladder will make it easier for many developing countries to increase their electricity use in a climate friendly manner.
[1] The data used for the analysis comes from the Monthly Energy Review Table 7.6: Electricity End Use. The slow trend and the cyclical components for the total electricity use refers to the column “Electricity Retail Sales, Total (Million Kilowatthours)”. [Link: http://www.eia.gov/totalenergy/data/browser/xls.cfm?tbl=T07.06&freq=m ]
[2] The output index that the BLS publishes is based on physical output where possible like mining, utilities, transport. Otherwise it uses deflated value output and applies Tornqvist aggregation. According to the BLS, "The resulting output indexes are conceptually equivalent to indexes that are developed using data derived from physical quantities of output." This is not a perfect measure of aggregate sectoral output, but it is clearly the best available output index and has been used by the EIA too. Source: http://www.bls.gov/opub/hom/pdf/homch11.pdf
TECHNICAL APPENDIX
Filtering Methodology
In signal theory, a filter is a device which removes from an original signal some specified component. By filtering a series we are solving a classical signal extraction problem, and the defining aspect of filters is the complete or partial suppression of some frequencies of the signal which interfere with the frequency of interest (and reduce background noise). Think about filtering as the treble or the bass control in your stereo used for adjusting the high or the low frequencies of the song you are listening to.
Filtering is mainly used in macroeconomics with the aim of de-trending long-term processes (GDP, TFP…) and study the short-run oscillations of the economy. This field was proposed successfully by Hodrick & Kydland (1982) and Hodrick & Prescott (1997); it was a methodological breakthrough of the Real Business Cycle (RBC) literature.
For our analysis, we use the Hodrick-Prescott Filter (HP), and we validate our results using the Butterworth Filter (BW).
The Hodrick–Prescott filter is an analytical device used in macroeconomics, particularly in the RBC literature to separate out the recurrent part of a time series from original data. It is used to derive a smoothed-curve representation of a time series, catching the short-term fluctuations. The tuning of the sensitivity of the trend to short-term fluctuations is achieved by modifying a smoothing parameter.
The Butterworth filter is a type of signal processing filter designed to have as flat a frequency response as possible in the passband. It is also referred to as a maximally flat magnitude filter. It was first described in 1930 by the British engineer and physicist Stephen Butterworth in his paper entitled "On the Theory of Filter Amplifiers".
We applied the Butterworth Filter for a robustness check for the Hodrick-Prescott filter. We also tried the Baxter-King and the Christiano-Fitzgerald filters, but they do not seem to do a good job as shown by an analysis of the sample spectral density function.
Hodrick-Prescott (HP) Filter in the Mainstream Media
Given the importance of macro-economic trends, every once in a while a discussion of HP filter pops up in the mainstream media. Recently Matt Yglesias of Vox.com listed HP filter as one of the nine essentials of neoclassical economics. BloombergView also blogged about this filter in a piece on business cycles. In July 2012, The New York Times columnist Paul Krugman wrote an opinion piece titled “Filters and Full Employment (Not Wonkish, Really)” in which he explained the HP filter as a:
“...technique that is supposed to extract underlying trends from data in which there is a lot of short-term fluctuation around the trend. To do this, it smooths” the data — roughly speaking, it takes a weighted average over a number of years. This smoothed measure is then supposed to represent the underlying trend.”
Application of Filtering to the Electricity Use Data
The methodological logic of HP filter was a good fit for analyzing the electricity consumption data which consists of monthly fluctuations that are capable of masking the underlying long-term trend. Our analysis showed that the results from filtering the time series resonated well with what many energy experts have already said about electricity use and peak load trends in the US. The HP filter enabled us to provide a reasonable statistical validation of expert opinion and descriptive analysis. Like any statistical technique, the HP filter embodies some assumptions—a usual feature of most statistical tools. To the best of our knowledge we are not aware of any application of the HP filter to the US electricity consumption data.
Empirical Approach
We estimate the trend and cyclical components using the “tsfilter hp” command of the statistical package Stata. The complete technical methodology and formula from Stata is described below.
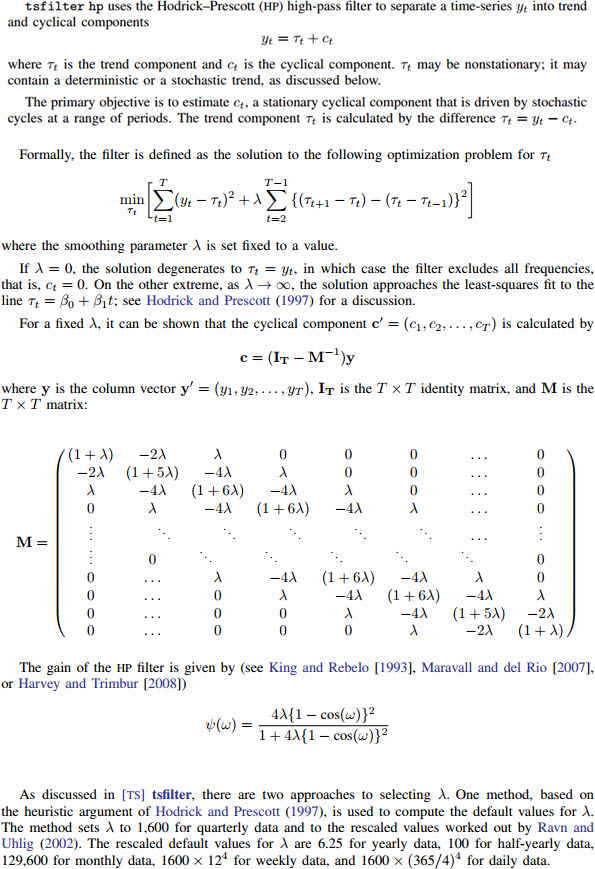
Additional technical description is available from Stata’s website.